| Oracle® Enterprise Manager System Monitoring Plug-In Installation Guide for Oracle Exadata Storage Server Release 1.1.4.0.0, 1.2.4.0.0, and 1.2.4.2.0 Part Number E14591-10 |
|
|
PDF · Mobi · ePub |
| Oracle® Enterprise Manager System Monitoring Plug-In Installation Guide for Oracle Exadata Storage Server Release 1.1.4.0.0, 1.2.4.0.0, and 1.2.4.2.0 Part Number E14591-10 |
|
|
PDF · Mobi · ePub |
System Monitoring Plug-In Installation Guide for Oracle Exadata Storage Server
Release 1.1.4.0.0, 1.2.4.0.0, and 1.2.4.2.0
E14591-10
August 2011
Oracle Exadata Storage Server is a storage product highly optimized for use with the Oracle database. Oracle Exadata Storage Server Software imparts database intelligence to the storage, and tightly integrate Exadata storage with the Oracle database, and all its features. For information about Oracle Exadata Storage Server Software, see Oracle Exadata Storage Server Software User's Guide.
Oracle System Monitoring Plug-In for Oracle Exadata Storage Server extends Oracle Enterprise Manager Grid Control (Grid Control) to add support for managing Oracle Exadata Storage Server.
Oracle Enterprise Manager System Monitoring Plug-In Installation Guide for Oracle Exadata Storage Server (this document) introduces the plug-in and provides step-by-step instructions on how to download, deploy, verify, and validate the plug-in.
Note:
You can access the latest version of this document at any time from Oracle Technology Network (OTN) available at the following URL.http://www.oracle.com/technology/documentation/oem.html
On the main documentation page, from the table, click View Library. On the Enterprise Manager documentation library page, click the Documentation tab, and scroll down to see this document in the portlet System Monitoring Plug-ins.
The System Monitoring Plug-In for Oracle Exadata Storage Server extends Grid Control to add support for managing Oracle Exadata Storage Server targets. By deploying the plug-in to your Grid Control environment, you gain the following management features:
Monitor Oracle Exadata Storage Server targets.
Gather storage configuration and performance information of various Oracle Exadata Storage Server-related storage components such as Grid Disks, Cell Disks, and so on.
Raise alerts and violations based on thresholds set on monitoring and configuration data.
Provide rich out-of-box metrics and reports based on the gathered data. For more information, see "Viewing Metrics and Reports".
Note:
High availability is not supported.This plug-in supports the following versions of products:
Oracle Exadata Storage Server 11g Release 1 (11.1) and later
Enterprise Manager Grid Control 10g Release 4 (10.2.0.4.0) and later (Oracle Management Service and Oracle Management Agent)
Oracle Management Agent 10g Release 4 (10.2.0.4.0) and later
Note:
You can also use Enterprise Manager Grid Control 10g Release 3 (10.2.0.3.0) to monitor Oracle Exadata Storage Server targets. However, although Enterprise Manager Grid Control 10g Release 3 (10.2.0.3.0) is supported, some features may not work in that version, so Oracle strongly recommends you to upgrade to Enterprise Manager Grid Control 10g Release 4 (10.2.0.4.0). And if you still want to use Enterprise Manager Grid Control 10g Release 3 (10.2.0.3.0), then apply the one-off patch 5844887 on Oracle Management Service 10g Release 3 (10.2.0.3.0) before deploying the plug-in.The following prerequisites must be met before you can deploy the plug-in:
Install Oracle Exadata Storage Server.
Install Enterprise Manager Grid Control 10g Release 4 (10.2.0.4.0) or later (both Oracle Management Service and Oracle Management Agent).
You can use the Agent installed with this Grid Control to monitor the Oracle Exadata Storage Server targets. The Agent can be installed on any host that can communicate with the Oracle Exadata Storage Server using the ethernet management IP address.
For information about installing Enterprise Manager Grid Control and Oracle Management Agent, see Enterprise Manager Grid Control Installation Guide at:
If you want to use an Agent that is different from the one installed with Grid Control, then install a separate Oracle Management Agent 10g Release 4 (10.2.0.4.0) or later on a different computer.
Establish SSH connectivity between Oracle Exadata Storage Server and the computer running the Agent. Ensure that you set it up as the Agent user. For information about setting up SSH connectivity, see "Setting Up SSH Connectivity".
Apply patch 8231631 to the Agent so that alerts appear properly in Grid Control.
Ensure that you use Oracle Exadata Storage Server11g Release 2 (11.2) or later to enable alerts to display additional component information from the Exadata cell with the alert message.
For more information, see My Oracle Support note 871634.1. You can access My Oracle Support at:
To set up SSH connectivity between the computer where Agent is running and the Oracle Exadata Storage Server, as the Agent user, do the following:
Log in to the computer where Agent is running, open a terminal, and run the following commands as the Agent user:
Generate a pair of authentication keys:
cd ~/.ssh
ssh-keygen -t dsa -f id_dsa
Upload the public key (id_dsa.pub) to the home directory of the user celladmin on the Oracle Exadata Storage Server:
scp id_dsa.pub root@<cell_ipaddress>:/tmp
Log in to Oracle Exadata Storage Server as the celladmin user and change to its home directory. Add the contents of the id_dsa.pub file to the authorized_keys file in the .ssh directory of the user cellmonitor.
ssh -l celladmin <cell_ipaddress>
ssh -l root <cell_ipaddress> "cat ~celladmin/id_dsa.pub >> ~cellmonitor/.ssh/authorized_keys"
If the authorized_keys file does not exist, then copy the id_dsa.pub file to the .ssh directory within the home directory of the user cellmonitor.
cp id_dsa.pub /home/cellmonitor/.ssh/authorized_keys
Open a new terminal and verify whether the SSH connectivity was successfully established:
ssh -l cellmonitor <cell_ipaddress> cellcli -e 'list cell detail'
If you are not prompted for any password, then you can assume that the connectivity is established.
If you are asked to confirm whether you want to continue connecting, specify Yes.
After you ensure that the prerequisites are met, follow these steps to deploy the plug-in:
Download the archive file of the System Monitoring Plug-In for Oracle Exadata Storage Server to your desktop or computer on which the browser is launched. You can download the archive from Oracle Technology Network (OTN) or from the product DVD.
Log in to Enterprise Manager Grid Control as SYSMAN.
Click Setup from the upper-right-corner of the Grid Control Home page, then click Management Plug-ins from the left-side menu of the Setup page.
The Management Plug-Ins page appears:
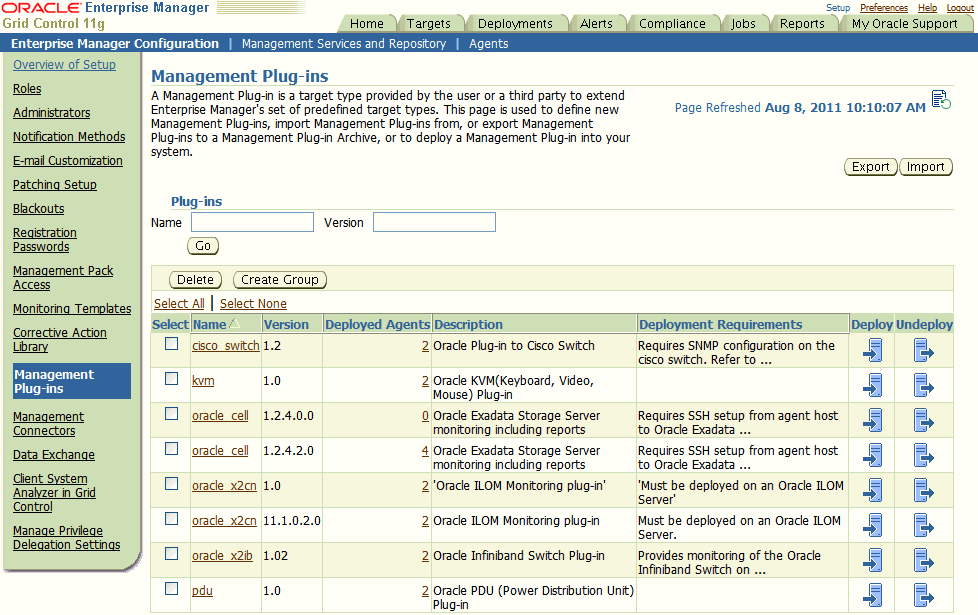
Click Import.
Click Browse and select the plug-in archive.
Click List Archive, which lists the plug-ins from the selected archive.
Select the plug-in and click OK.
Verify that you have set preferred credentials on all Agents where you want to deploy the plug-in.
In the Management Plug-ins page, click the icon in the Deploy column for the System Monitoring Plug-In for Oracle Exadata Storage Server.
The Deploy Management Plug-in wizard appears.
Click Add Agents, then select the desired agent to deploy the plug-in. It is not required to distribute the plug-in across multiple agents for performance. It can be done for functional reasons if desired. For example, if a physical hardware rack is divided into multiple functional components (that is, some portion for QA, Prod, etc.), the plug-in can be deployed to multiple compute nodes, and the monitoring of storage cells for each component can be divided in that logical fashion.
Note:
The Agent can be on any host that can communicate with the Oracle Exadata Storage Server using the ethernet management IP address.The wizard reappears and displays the Agent you selected.
Click Next, then click Finish.
If you see an error message stating that the preferred credential is not set up, go to the Preferences page and add the preferred credentials for the Agent target type. To go to the Preferences page, click Preferences from the top-right corner of the Grid Control page.
After successfully deploying the plug-in, follow these steps to add the Oracle Exadata Storage Server target to Grid Control for central monitoring and management:
To complete this task, you will need the IP addresses of the Oracle Exadata Storage Server cells. To get this information, log in to the cell and view the /etc/hosts file. The information you will need to collect will look like this:
# more /etc/hosts
#### BEGIN Generated by Exadata. DO NOT MODIFY ####
127.0.0.1       localhost.localdomain   localhost

123.456.789.1   machinename.public.company.com     machinename
111.222.333.1   machinename-priv.company.com       machinename-priv
On the Agent home page, from the Monitored Targets section, select the Oracle Exadata Storage Server target type from the Add list, then click Go.
The Add Oracle Exadata Storage Server page appears:

Provide the following information for the parameters:
Name: enter the name of the Oracle Exadata Storage Server to be added in the “Name” field.
Management IP Address 1: Specify the IP address of the Oracle Exadata Storage Server. Ensure that the IP address is accessible (visible) from the computer where Management Agent is running.
Management IP Address 2: Enter the IP address of the InfiniBand Network (bond0 interface) on the Oracle Exadata Storage server. Ensure that the IP address is accessible (visible) from the computer where Management Agent is running. Each Oracle Exadata Storage cell must have all IPs configured.
Click Test Connection to make sure the parameters you entered are correct.
Reenter the encrypted parameters from step 2 if the connection test was successful, then click OK.
Note:
To set up failover, please refer to the Oracle Database Machine Monitoring Best Practices knowledge article (document ID 1110675.1) in My Oracle Support.For security reasons, Oracle recommends that the SYSMAN account be used only as a template to create other accounts, and not used directly.
Therefore to manage the plug-in, you need to create roles and administrators, and then assign roles to administrators. This restricts the privileges that each user has, for example deleting the plug-in or accessing reports.
Follow the steps provided in this section to provide management rights to users.
Log in to Enterprise Manager Grid Control as SYSMAN.
Click Setup.
The Setup page appears.
To create roles, click Roles. Click Help for assistance.
To create administrators, click Administrator. Click Help for assistance.
When the newly created administrator logs in, unlike SYSMAN, the administrator is restricted by the privileges set.
Susan, the super administrator, wants to let Maria view the Oracle Exadata Storage Server target Exadata0526.
When Maria accesses the reports, if privileges are not set for Maria to view the Oracle Exadata Storage Server target, then the rows for Exadata0526 will not be displayed in the report. Therefore, for Maria to view Exadata0526, Susan has to set privileges as illustrated below:
Susan launches Enterprise Manager Grid Control and then in the Setup page, selects Roles.
She uses the Create Roles page to create a role for assigning to Maria.
In the Create Role Properties page, she specifies the name of the role as Maria_Role.
In the Create Role: Roles page, she chooses an existing role that can be applied to the role Maria_Role.
In the Create Roles System Privileges page, she chooses the system privileges for Maria.
In the Create Role Target Privileges page, she first selects a target, then sets the View privileges for the role, so that Maria (when assigned with this role) has the rights to view the Oracle Exadata Storage Server target.
To set a target, click Add. In the Search and Select pop-up window, select Oracle Exadata Storage Server from the Target Type drop-down menu. Choose an item to add and click Select: 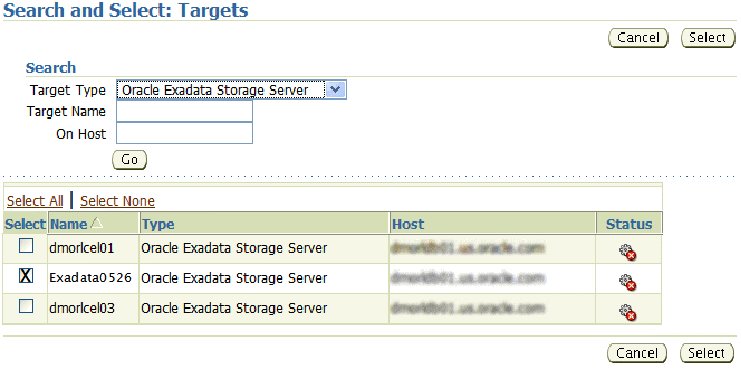
By default, privileges are set to View. To change the privileges, click the Edit icon next to the current privilege setting.
In the Create Role Administrators page, she grants Maria the role.
In the Create Role Review page, she reviews the details and clicks Finish to end the process.
After waiting for a few minutes for the plug-in to start collecting data, use the following steps to verify and validate that Grid Control is properly monitoring the plug-in:
In the Agent Home page, from the Monitored Targets table, click the Oracle Exadata Storage Server target link. The Oracle Exadata Storage Server Home page appears:
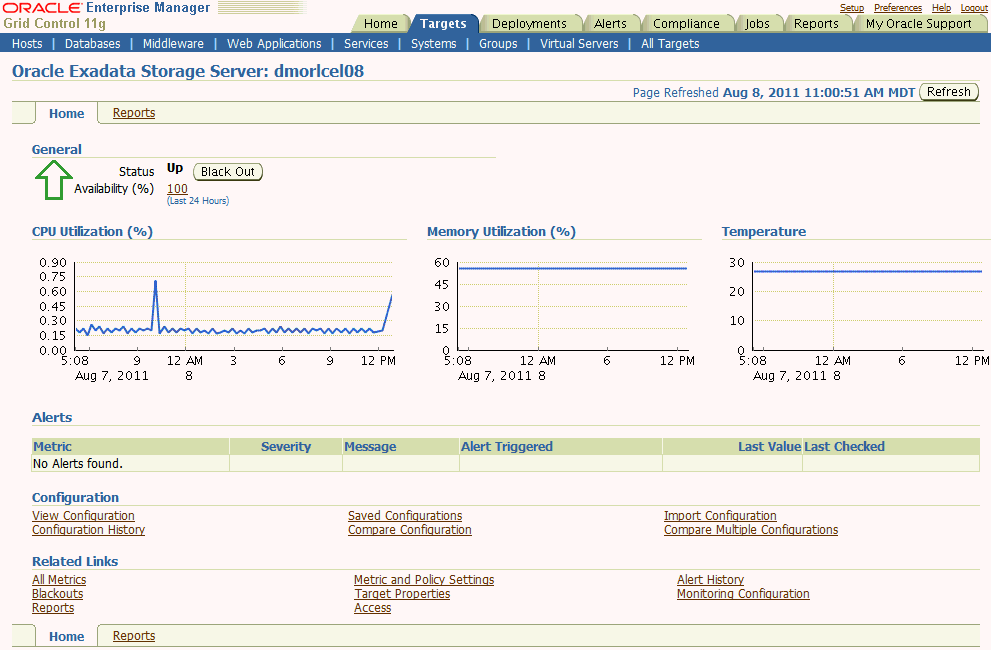
Verify that no metric collection errors are reported in the Metrics table.
Ensure that reports can be seen and no errors are reported by selecting the Reports property page.
Ensure that configuration data can be seen by clicking the View Configuration link in the Configuration section.
If configuration data does not immediately appear, click Refresh in the View Configuration page.
Note:
After you deploy and configure the plug-in to monitor one or more targets in the environment, you can customize the monitoring settings of the plug-in. This alters the collection intervals and threshold settings of the metrics to meet the particular needs of your environment. If you decide to disable one or more metric collections, this could impact the reports that the metric is a part of.Instructions for configuring a high availability solution for the Exadata Storage cell or any other Exadata plug-in are documented in the Oracle Database Machine Monitoring Best Practices (Doc ID 1110675.1) document located in My Oracle Support.
Once the plug-in is installed and Oracle Exadata Storage Server targets are added to Grid Control, you can start monitoring them.
To monitor Oracle Exadata Storage Server targets:
Log in to Enterprise Manager Grid Control.
Select Targets, then All Targets. The All Targets page appears.
In the All Targets page, from the Search list, select Oracle Exadata Storage Server and click Go. The page refreshes and lists only the Oracle Exadata Storage Server targets.
Click the Oracle Exadata Storage Server target you are interested in. The Oracle Exadata Storage Server Home page appears:

The Oracle Exadata Storage Server Home page provides information about the health of the target and offers links for viewing configuration details and for performing other related tasks.
Click Reports (the tab next to Home tab) to view reports generated for the monitored Oracle Exadata Storage Server target.
To view more details about reports, see the Oracle Enterprise Manager System Monitoring Plug-In Metric Reference Manual for Oracle Exadata Storage Server available in the Enterprise Manager documentation library at:
General: This section shows you the current status of Oracle Exadata Storage Server and the percentage of time the target was up during the last 24 hours. You can click the percentage link to view available details over the last 24 hours. You can also click Black Out to schedule a blackout and suspend monitoring of the server. Blackouts are done to prevent unnecessary alerts while your target is down for maintenance.
Alerts: This section shows a list of alerts triggered for Oracle Exadata Storage Server. Alerts represent events of importance occurring within the server, typically indicating that Oracle Exadata Storage Server is either compromised or in danger of failure.
When an alert is triggered, this section shows the name of the metric for which the alert is triggered, the severity of the alert, the date and time when it was triggered, the alert value, and the time the metric value was last checked.
For more information about alerts, see Oracle Exadata Storage Server Software User's Guide.
Configuration: This section provides links that allow you to manage the configuration settings of an Oracle Exadata Storage Server target.
Table 1 Configuration Section Description - Oracle Exadata Storage Server Home Page
| Section | Description |
|---|---|
|
View Configuration |
Allows you to view the last collected configuration information. The configuration information is collected from the Oracle Exadata Storage Server target every 24 hours. You can click Refresh on the View Configuration page to refresh the configuration details. The refresh option connects to the Oracle Exadata Storage Server target and collects the latest configuration information. |
|
Saved Configuration |
Allows you to view the configuration information saved at a given point. |
|
Import Configuration |
Allows you to import the configuration information that was previously exported from the Configuration property page. |
|
Configuration History |
Allows you to access historical information and view the configuration files that changed in the past. |
|
Compare Configuration |
Allows you to compare the configuration of a selected Oracle Exadata Storage Server target with another Oracle Exadata Storage Server target. |
|
Compare to Multiple Configurations |
Allows you to compare the configuration of two or more Oracle Exadata Storage Server targets. |
Related Links: This section provides links that allow you to navigate to other pages in Grid Control that might be helpful in accomplishing your given task. The following describes the related links on this page.
Table 2 Related Links Section Description - Oracle Exadata Storage Server Home Page
| Section | Description |
|---|---|
|
All Metrics |
Lists all the metrics collected for Oracle Exadata Storage Server. By selecting a metric, you can determine whether thresholds have been defined for a particular metric. |
|
Metric and Policy Settings |
Starting point for customizing metric threshold settings, policy settings, and collection settings. Enables you to save monitoring settings of a target to a template and apply monitoring settings in a template to a target. |
|
Alert History |
Displays a chart that shows the alert history of an Oracle Exadata Storage Server target in segments of time that you designate. |
|
Blackouts |
Displays a list of the blackouts that are currently scheduled or in progress for an Oracle Exadata Storage Server target. |
|
Monitoring Configuration |
Allows you to configure an Oracle Exadata Storage Server target and enable monitoring. |
|
Reports |
Provides access to reports that have been defined within Enterprise Manager environment. |
|
Access |
Allows a target owner or Super Administrator to grant target access privileges to other Enterprise Manager administrators. |
|
Target Properties |
Allows you to update generic target properties. |
Groups are an efficient and effective way to logically organize, manage, and monitor the components in your environment. Each group has its own group home page that shows the most important information for the group, and enables you to drill down for more information.
You can create a group for a set of Oracle Exadata Storage Server targets and monitor them as a single entity. This way, you can map your groups and targets with Realms and Cells, respectively.
To create a group:
Log in to Enterprise Manager Grid Control as SYSMAN.
Click Targets and then Groups.
Enterprise Manager Grid Control displays the Groups page.
In the Groups page, click Add.
Enterprise Manager Grid Control displays the Create Group wizard that has four tabs, mainly Members, Charts, Columns, and Dashboard.
In the Members page of the Create Group wizard, do the following:
In the top section, in the Name field, specify a name for the group you are creating.
In the Members section, click Add and select the Oracle Exadata Storage Server targets you want to add to this group.
In the Time Zone section, select an appropriate time zone.
In the Charts page of the Create Group wizard, specify the charts that you want to see for your group.
In the Columns page of the Create Group wizard, specify the columns and abbreviations you want to see in the Group Members page and also in the Dashboard provided in Enterprise Manager Grid Control.
In the Dashboard page of the Create Group wizard, specify the parameters you want to see in the Dashboard.
Click OK.
Enterprise Manager Grid Control displays the Groups page that shows the newly created group.
In the Groups page, click the group name to view details about that group.
Enterprise Manager Grid Control displays the Group Home page. You can access the other tabs, such as Charts, Administration, and Members to view more details. You can also click Launch Dashboard to view the dashboard.
For information about the elements used on the page and tasks that can be performed on each page, click Help from the top-right corner of the page.
Before you set up alerts in Grid Control, ensure that you apply the required patches to Agent and Exadata Storage Server. For more information about these patches, see "Prerequisites".
After you apply the patches to Agent and Exadata Storage Server, configure the Oracle Exadata Storage Server targets to send SNMP alerts to the Management Agent that is monitoring them.
To do so, run the following commands:
alter cell notificationPolicy=critical
alter cell notificationMethod=snmp
alter cell snmpSubscriber=((host=agenthostname,port=portno))
alter cell validate snmp
Note:
If your host name contains characters other than alphabets and numbers, then ensure that you enclose the host name in single quotes. For example, if the host name is xyz001.server.com, then run the snmpSubscriber command as shown below:
alter cell snmpSubscriber=((host='xyz001.server.com',port=123))
The SNMP receivelet listens on a single address and port for all monitored targets. The port is the UDP port with the same number as the TCP port used in the EMD_URL.
By default, the SNMP receivelet listens on all addresses; if the property SnmpRecvletListenNIC is set in emd.properties, the receivelet will attempt to resolve the value as either a name or IP address, and listen on only that address. (This parameter is independent of AgentListenOnAllNICs and EMD_URL because in some installations, the Agent may need to communicate with the OMS and with managed targets on different networks.
If you are using the DCLI utility to set an alert, then any command containing punctuation, which will be interpreted by the local shell, must be enclosed with double quotation marks. If the command includes the following characters, then outer quotation marks and escape characters are required:
$ (dollar sign)
' (quotation mark)
< (less than)
> (greater than)
( ) (parentheses)
The backslash (\) is the escape character that allows the characters to be passed to the CellCLI utility without being interpreted by the remote shell.
After configuring the Oracle Exadata Storage Server targets to send SNMP alerts, set up alerts in Grid Control. To do so:
Log in to Enterprise Manager Grid Control as SYSMAN.
Select Targets, then All Targets. The All Targets page appears.
In the All Targets page, from the Search list, select Oracle Exadata Storage Server and click Go. The page refreshes and lists only the Oracle Exadata Storage Server targets.
Click the Oracle Exadata Storage Server target you are interested in. The Oracle Exadata Storage Server Home page appears.
In the Oracle Exadata Storage Server Home page, from the Related Links section, click Metric and Policy Settings. The Metric and Policy Settings page appears:
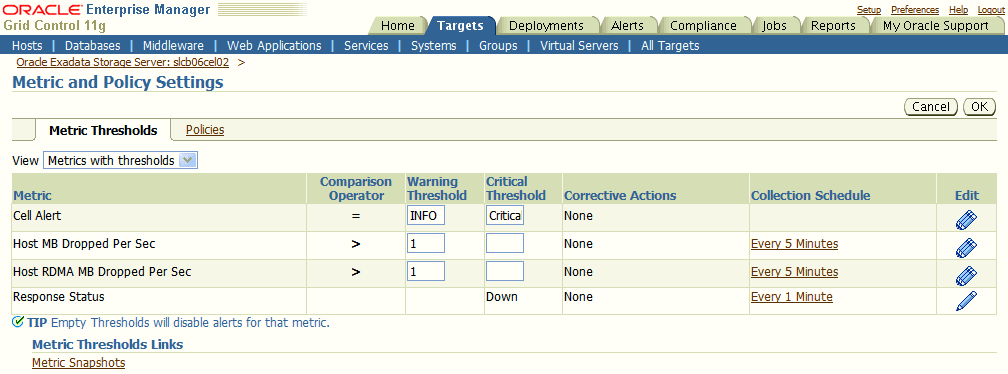
In the Metric and Policy Settings page, you can modify metric threshold values, edit monitoring settings for specific metrics, change metric collection schedules, and disable collection of a metric.
You can modify the thresholds directly in the table or click the edit icon (pencil icon) to access the Edit Advanced Settings page. For more information on the fields displayed in this page and how the thresholds can be modified, click Help from the top-right corner of this page.
Metrics are units of measurement used to determine the health of an Oracle Exadata Storage Server target. It is through the use of metrics and associated thresholds that Grid Control generates alerts notifying you of problems with the Oracle Exadata Storage Server target. Grid Control offers a comprehensive set of metrics and reports.
The following are the different categories of metrics generated for an Oracle Exadata Storage Server target:
Table 3 Oracle Exadata Storage Server Metrics
|
|
The following are the reports generated for an Oracle Exadata Storage Server target:
Table 4 Oracle Exadata Storage Server Reports
|
|
To view these metrics and reports in Enterprise Manager Grid Control:
Log in to Enterprise Manager Grid Control.
Click Targets and All Targets. The All Targets page appears with a list targets being monitored by Grid Control.
In the All Targets page, from the Search list, select Oracle Exadata Storage Server and click Go.
Click the Oracle Exadata Storage Server target for which you want to view metrics and reports. The Oracle Exadata Storage Server Home page appears.
To view a list of metrics, in the Oracle Exadata Storage Server Home page, from the Related Links section, click All Metrics.
In the All Metrics page, you can click Expand All to expand and view all the metrics in one table. Click the metric link in each row to view more details about that metric. In the individual metrics page, you can use the View Data list to refresh and collect data again from the Oracle Exadata Storage Server target.
To view a list of reports, click Reports (the tab that is placed next to the Home tab). In the Reports page, from the View Report list, select the report you are interested in.
In the Reports page, you can use the refresh icon to refresh the details based on the data stored in the OMS. Note that this refresh icon does not collect data again from the Oracle Exadata Storage Server target, but it refreshes the page based on the data that is available in the OMS. The actual collection of data from the Oracle Exadata Storage Server target occurs only once in 24 hours.
To view descriptions of these metrics and reports, see the Oracle Enterprise Manager System Monitoring Plug-In Metric Reference Manual for Oracle Exadata Storage Server available in the Enterprise Manager documentation library at:
Follow these steps to undeploy the plug-in from an Agent:
Log in to Enterprise Manager Grid Control as SYSMAN.
Select Targets, then All Targets. The All Targets page appears.
In the All Targets page, from the Search list, select Oracle Exadata Storage Server and click Go. The page refreshes and lists only the Oracle Exadata Storage Server targets.
Select the Oracle Exadata Storage Server target you want to undeploy and click Remove. You must do this step for all targets of the plug-in.
Make sure that the preferred credentials are set on the Agents where the plug-in was deployed.
Click Setup from the top-right corner of the All Targets page, then click Management Plug-ins from the left side menu of the Setup page.
The Management Plug-ins page appears.
Click the icon in the Undeploy column for the System Monitoring Plug-In for Oracle Exadata Storage Server.
The Undeploy Management Plug-in page appears.
Check all the Agents that are currently deployed with the System Monitoring Plug-In for Oracle Exadata Storage Server, and click OK.
You must undeploy the plug-in from every Agent in the system to completely remove it from the enterprise.
Return to the Management Plug-Ins page, select the System Monitoring Plug-In for Oracle Exadata Storage Server, and click Delete.
For information about all known issues and the issues fixed in this release, refer to the Oracle Enterprise Manager Release Notes for System Monitoring Plug-In for Oracle Exadata Storage Server available at:
For information about Oracle's commitment to accessibility, visit the Oracle Accessibility Program website at http://www.oracle.com/pls/topic/lookup?ctx=acc&id=docacc.
Oracle customers have access to electronic support through My Oracle Support. For information, visit http://www.oracle.com/pls/topic/lookup?ctx=acc&id=info or visit http://www.oracle.com/pls/topic/lookup?ctx=acc&id=trs if you are hearing impaired.
System Monitoring Plug-In Installation Guide for Oracle Exadata Storage Server, Release 1.1.4.0.0, 1.2.4.0.0, and 1.2.4.2.0
E14591-10
Copyright © 2011, Oracle and/or its affiliates. All rights reserved.
This software and related documentation are provided under a license agreement containing restrictions on use and disclosure and are protected by intellectual property laws. Except as expressly permitted in your license agreement or allowed by law, you may not use, copy, reproduce, translate, broadcast, modify, license, transmit, distribute, exhibit, perform, publish, or display any part, in any form, or by any means. Reverse engineering, disassembly, or decompilation of this software, unless required by law for interoperability, is prohibited.
The information contained herein is subject to change without notice and is not warranted to be error-free. If you find any errors, please report them to us in writing.
If this is software or related documentation that is delivered to the U.S. Government or anyone licensing it on behalf of the U.S. Government, the following notice is applicable:
U.S. GOVERNMENT RIGHTS Programs, software, databases, and related documentation and technical data delivered to U.S. Government customers are "commercial computer software" or "commercial technical data" pursuant to the applicable Federal Acquisition Regulation and agency-specific supplemental regulations. As such, the use, duplication, disclosure, modification, and adaptation shall be subject to the restrictions and license terms set forth in the applicable Government contract, and, to the extent applicable by the terms of the Government contract, the additional rights set forth in FAR 52.227-19, Commercial Computer Software License (December 2007). Oracle America, Inc., 500 Oracle Parkway, Redwood City, CA 94065.
This software or hardware is developed for general use in a variety of information management applications. It is not developed or intended for use in any inherently dangerous applications, including applications that may create a risk of personal injury. If you use this software or hardware in dangerous applications, then you shall be responsible to take all appropriate fail-safe, backup, redundancy, and other measures to ensure its safe use. Oracle Corporation and its affiliates disclaim any liability for any damages caused by use of this software or hardware in dangerous applications.
Oracle and Java are registered trademarks of Oracle and/or its affiliates. Other names may be trademarks of their respective owners.
Intel and Intel Xeon are trademarks or registered trademarks of Intel Corporation. All SPARC trademarks are used under license and are trademarks or registered trademarks of SPARC International, Inc. AMD, Opteron, the AMD logo, and the AMD Opteron logo are trademarks or registered trademarks of Advanced Micro Devices. UNIX is a registered trademark of The Open Group.
This software or hardware and documentation may provide access to or information on content, products, and services from third parties. Oracle Corporation and its affiliates are not responsible for and expressly disclaim all warranties of any kind with respect to third-party content, products, and services. Oracle Corporation and its affiliates will not be responsible for any loss, costs, or damages incurred due to your access to or use of third-party content, products, or services.