7 Monitoring a Database on Windows
This chapter describes how to monitor Oracle Database for Windows.
This chapter contains these topics:
Overview of Database Monitoring Tools
Table 7-1 describes tools that enable you to monitor Oracle Database.
Table 7-1 Database Monitoring Tools
| Tool | Functionality |
|---|---|
|
Event Viewer |
Monitor database events. |
|
Trace Files |
Record occurrences and exceptions of database operations |
|
Alert Logs |
Record important information about error messages and exceptions during database operations. |
|
Oracle Enterprise Manager Database Management Packs |
Monitor and tune using tools with real-time graphical performance information. See Also: Your Oracle Enterprise Manager documentation set for more information |
|
Oracle Administration Assistant for Windows |
View information about or terminate any Oracle thread. |
See Also:
Oracle Database Performance Tuning Guide for general tuning informationAbout Event Viewer
Oracle Database for Windows problems and other significant occurrences are recorded as events in an application event log. View and manage these recorded events in Event Viewer.
Using Event Viewer
To access Event Viewer:
-
From the Start menu, select All Programs, then select Administrative Tools, and then select Event Viewer.
The Event Viewer window appears.
-
Select Windows Logs.
-
Double-click Application to open the Application view window.
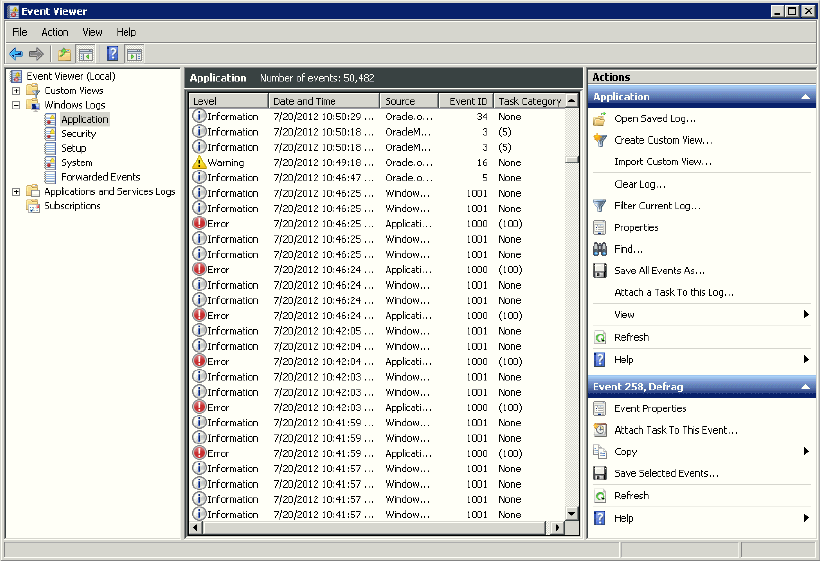
Figure 7-1 displays the Application view window, Table 7-2 shows what is recorded in each column, and Table 7-3 interprets icons that appear on the left hand side of the viewer.
Table 7-2 Application View Definitions
| Column Name | Definition |
|---|---|
|
Date and Time |
Date and time at which event took place |
|
Source |
Application that recorded event |
|
Event ID |
Unique number assigned to event |
|
Task Category |
Classification of event |
| Icon | Event Type | Suggested Action |
|---|---|---|
|
Exclamation Point in Red Circle |
Error |
Error identification. Always check these icons. |
|
Lowercase "i" in Blue Circle |
Information |
Noncritical system events. Check these icons only to track a specific event. |
|
Exclamation Point in Yellow Triangle |
Warning |
Special events, such as instance termination or services shutdown. Investigate these icons, but they are usually noncritical. |
Reading Event Viewer
Oracle Database for Windows events are displayed with a source of Oracle.SID.
Event number 34 specifies an audit trail event. These events are recorded if the parameter AUDIT_TRAIL is set to db (true) or os in the initialization parameter file. Option os enables systemwide auditing and causes audited records to be written to Event Viewer. Option db enables systemwide auditing and causes audited records to be written to the database audit trail (table SYS.AUD$). Some records, however, are written to Event Viewer.
Event numbers other than 34 specify general database activities, such as an instance being started or stopped.
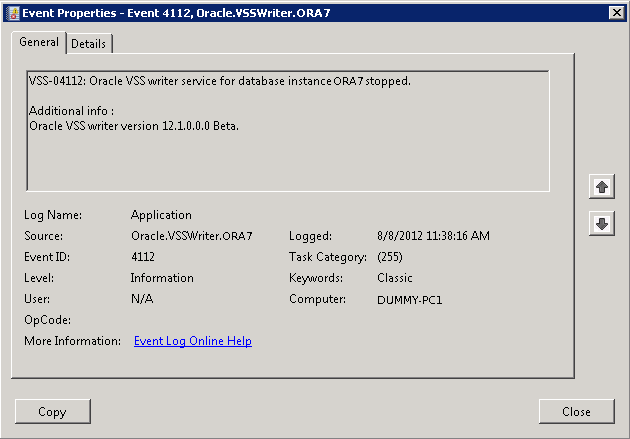
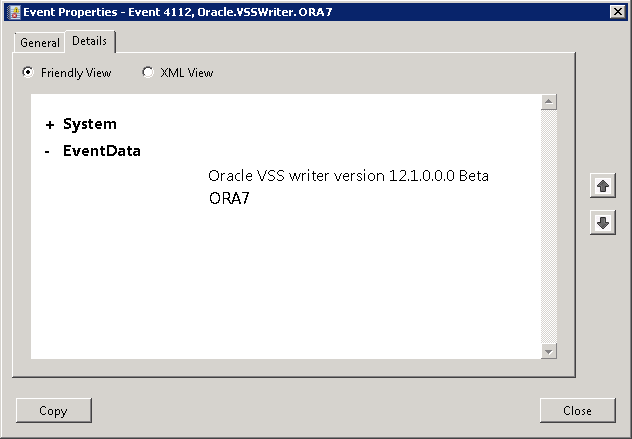
When you double-click an icon in Event Viewer, the Event Properties dialog box appears with more information about the selected event. Figure 7-2, for example, shows details about Event ID 4112. In the General tab, you find a text description of the event. In the Details tab, you can select Friendly View to see the System and Event Data in words or XML View to see the same information in XML format, as shown in Figure 7-3.
See Also:
Microsoft operating system documentation for more information about using Event ViewerManaging Event Viewer
Setting AUDIT_TRAIL to db or os causes more records to be written to Event Viewer. This can fill up the Event Viewer log file. Follow these procedures to increase log file size:
-
Right-click the event log in which you want to set size, and select Properties.
The event Log Properties window appears.
-
Use the up and down arrow keys to set the size you want in the Maximum log size box.
-
Under When maximum event log size is reached, select one of the options that you want. The options are as follows:
-
Overwrite events as needed (oldest events first)
-
Archive the log when full, do not overwrite events
-
Do not overwrite events (clear log manually)
-
-
If you want to clear the log contents, click Clear Log.
-
Click OK.
You return to Event Viewer.
About Trace Files
Oracle Database for Windows background threads use trace files to record occurrences and exceptions of database operations, and errors. Background thread trace files are created and stored in the Automatic Diagnostic Repository (ADR) directory specified by the parameter DIAGNOSTIC_DEST in the initialization parameter file.
Oracle Database creates a different trace file for each foreground and background thread. The name of the trace file contains the name of the thread, followed by the extension ".trc". The following are examples of foreground trace file names:
-
ops_ora_5804.trc -
ops_ora_4160.trc
The following are examples of background trace file names:
-
ops_pmon_1556.trc -
ops_mmon_3768.trc -
ops_lgwr_2356.trc -
ops_dbw0_132.trc
Trace files are also created for user threads and stored in the ADR directory specified by the parameter DIAGNOSTIC_DEST in the initialization parameter file. Trace files for user threads have the form oraxxxxx.trc, where xxxxx is a 5-digit number indicating the Windows thread ID.
About Alert Logs
Alert logs contain important information about error messages and exceptions that occur during database operations. Each Oracle Database for Windows instance has one alert log; information is appended to the file each time you start the instance. All threads can write to the alert log.
For example, when automatic archiving of redo logs is halted because no disk space is available, a message is placed in the alert log. The alert log is the first place to check if something goes wrong with the database and the cause is not immediately obvious.
The alert log is named alert_SID.log and is found in the ADR directory specified by the parameter DIAGNOSTIC_DEST in the initialization parameter file. Alert logs should be deleted or archived periodically.
See Also:
-
"ADMIN Directory" section in Oracle Database Installation Guide for Microsoft Windows
Viewing Oracle Database Thread Information
To view information about Oracle Database threads using Oracle Administration Assistant for Windows, you must either enable Windows native authentication for the database or run the utility ocfgutil.exe with arguments username and password. The utility stores the user name and password in the following registry location:
HKEY_LOCAL_MACHINE\SYSTEM\CurrentControlSet\Services\OracleOraConfig
When Windows native authentication is not enabled, Oracle Remote Configuration Agent retrieves the user name and password from this registry key to log in to the database.
To view information about Oracle Database threads using Oracle Administration Assistant for Windows:
-
From the Start menu, select All Programs, then select Oracle - HOMENAME, then select Configuration and Migration Tools, and then select Administration Assistant for Windows.
-
Right-click the
SID, whereSIDis a specific instance name, such asorcl. -
Select Process Information.
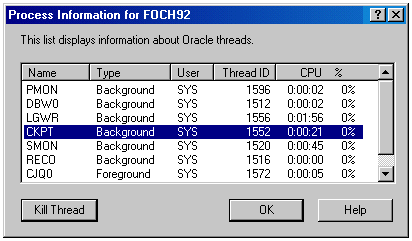
The Process Information dialog box appears, listing name, type, user, thread ID, and CPU usage for each Oracle Database thread.
-
To terminate a thread, select it, and click Kill Thread.

Description of the illustration procinfo.gif


