Release 4.0
Part Number E18709-01
Contents
Previous
Next
| Oracle Application Management Pack for Oracle E-Business Suite User's Guide Release 4.0 Part Number E18709-01 | Contents | Previous | Next |
The Concurrent Processing Dashboard provides you with details in concurrent processing in your Oracle E-Business Suite system. The dashboard gives you a complete picture of concurrent processing on your system, both current activity as well as usage statistics.
You can add a user-defined concurrent program as a target to the Oracle E-Business Suite composite target. You can then monitor related activities of the registered individual concurrent programs for your own specified thresholds.
You can also add a user-defined concurrent manager as a target to the Oracle E-Business Suite composite target. You can then monitor related activities of the registered individual concurrent managers for your own specified thresholds.
The Concurrent Processing Dashboard is available from the Performance tab of the main Administration Dashboard, under Concurrent Processing.
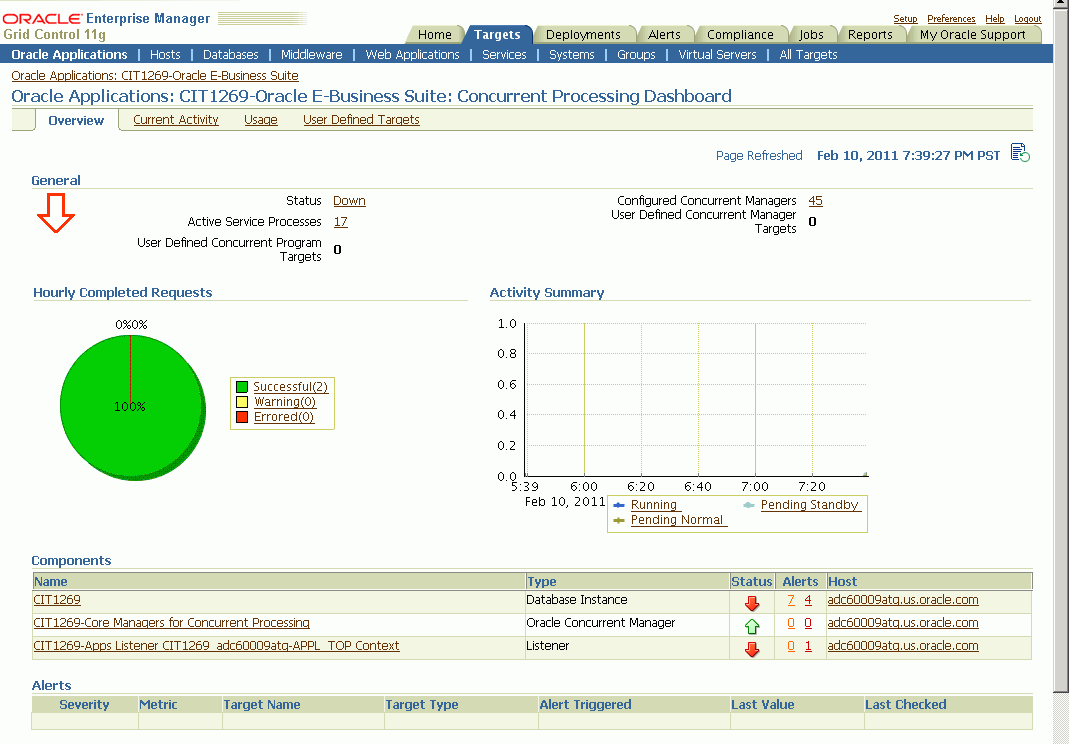
The General region lists the status of the Concurrent Processing Service
Status - The status is linked to the Concurrent Processing Service home page.
Active Service Processes - Number of active service processes.
User-defined Concurrent Program Targets - Defining these targets is described in a later section.
Configured Concurrent Managers - The number of configured concurrent managers.
The Hourly Completed Requests region shows a pie chart for requests by status (Successful, Warning, and Errored).
The Activity Summary graph illustrates active requests in the following statuses
Pending Normal
Pending Standby
Running
The Components region lists components of the Concurrent Processing service. The table shows the following for each component:
Name
Type
Status
Alerts
Host
The Alerts region lists any alerts that were triggered recently, with the following information for each:
Severity
Metric
Target Name
Target Type
Alert Triggered
Last Value
Last Checked
At the bottom of the dashboard are Related Links:
The first three links provide metrics on requests and processes:
Hourly Completed Requests
Processes and Requests per Concurrent Manager
Active Concurrent Requests by Application
The last three links take you to Oracle Applications Manager pages for the Oracle E-Business Suite instance:
Concurrent Request Runaways
Concurrent Processing Reports
Concurrent Processing Charts
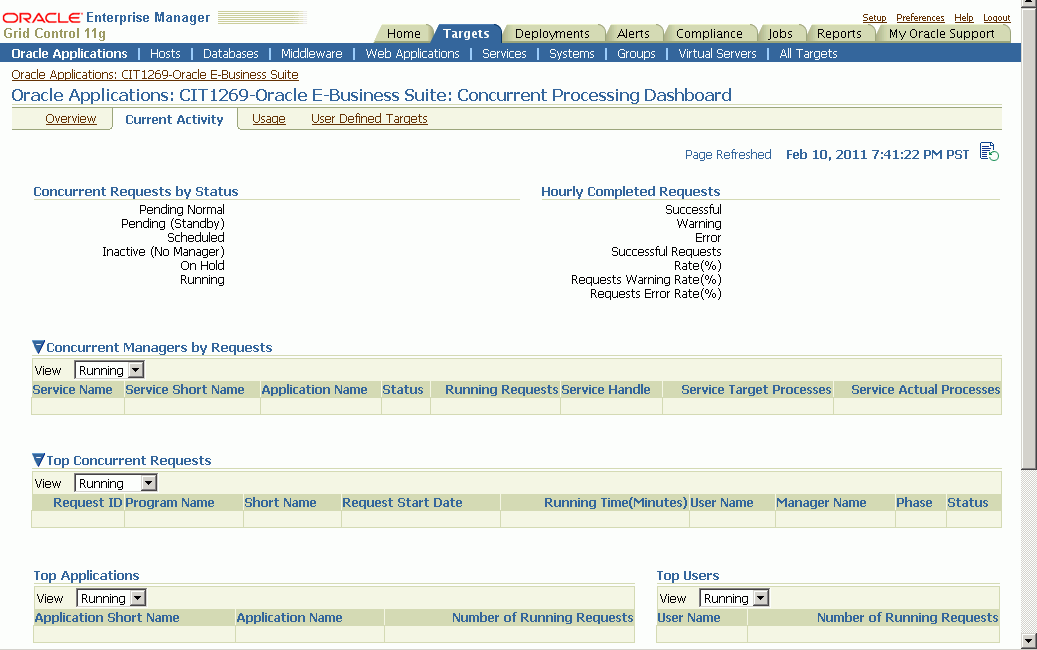
The Concurrent Requests by Status region lists the number of requests for each status:
Pending Normal
Pending (Standby)
Scheduled
Inactive (No Manager)
On Hold
Running
Click on the number for a status to find out more about the metric trend.
The Hourly Completed Requests region lists statistics for requests that have completed in the past hour, including:
Successful
Warning
Error
Successful Requests Rate (%)
Requests Warning Rate (%)
Requests Error Rate (%)
Click on the number for each statistic to find out more details.
The Concurrent Managers by Requests lists all concurrent managers, in order of the number of requests it has in the specified status, either Running or Pending.
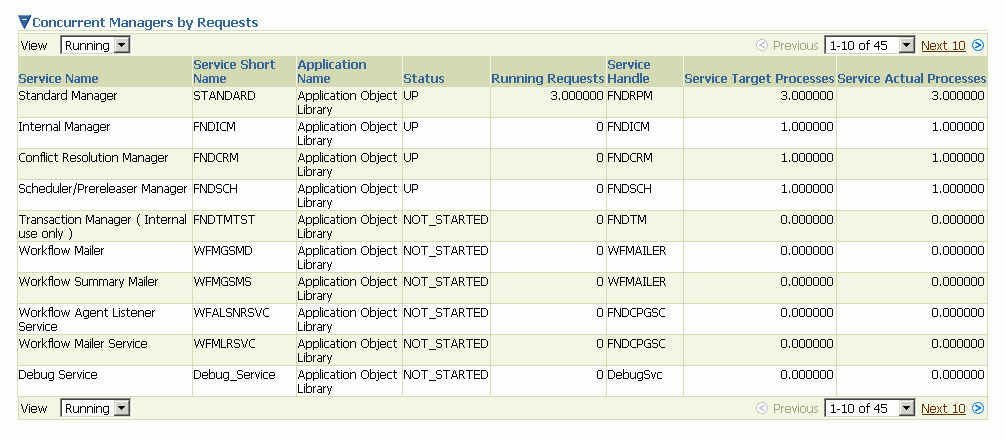
With "Running" selected, the following is shown for each concurrent manager:
Service Name
Service Short Name
Application Name
Status
Running Requests
Service Handle
Service Target Processes
Service Actual Processes
With "Pending" selected, the following is shown for each concurrent manager:
Service Name
Service Short Name
Application Name
Status
Normal Pending Requests
Standby Pending Requests
Service Handle
Service Target Processes
Service Actual Processes
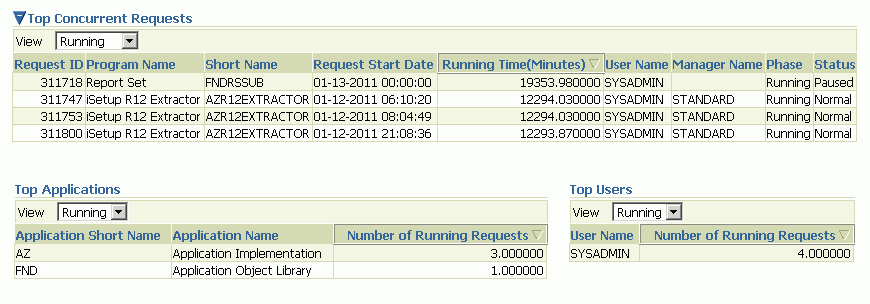
The Top Concurrent Requests region shows the top ten (10) requests for the specified status of Running, Pending, or Scheduled.
Running - These are sorted by running time in descending order.
Pending - These are sorted by running time in descending order.
Scheduled - These are sorted by their scheduled start time.
The Top Applications region lists the top ten (10) applications for running requests or pending requests, as specified.
The Top Users region lists the top ten (10) users by number of running or pending requests, as specified.
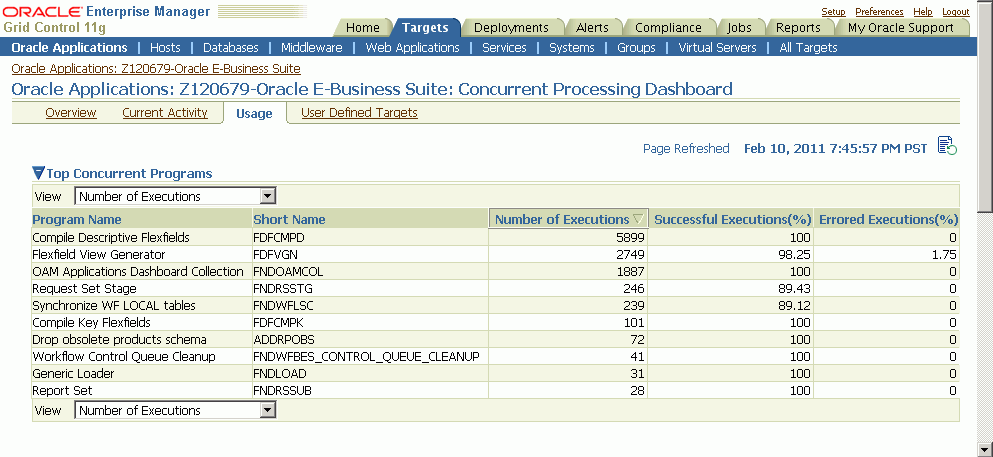
This tab provides a summary of how the concurrent programs and managers have been utilized over a period of time.
The top ten (10) concurrent requests for the following categories are listed:
Number of executions - For this category, the total number of executions, the percentage (%) of successful executions, and the percentage (%) of errored executions are shown.
Number of failed executions - The number of executions, percentage (%) of failed executions, and percentage (%) of errored executions are shown.
Average run time in minutes - The number of executions, average running time (minutes), and total running time (minutes) are shown.
Total run time in minutes - The top ten (10) programs with the highest maximum running time are shown. For each program listed, the number of executions, total running time (minutes) and percentage (%) of successful executions are shown.
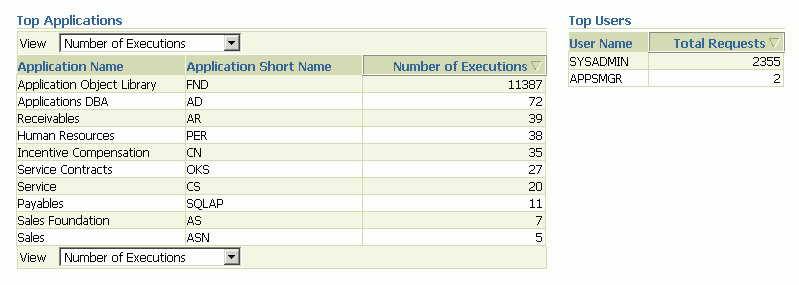
The top ten (10) applications for the following categories are listed:
Number of executions
Number of failed executions
The top ten (10) users by total number of requests are also listed, in descending order of number of requests.
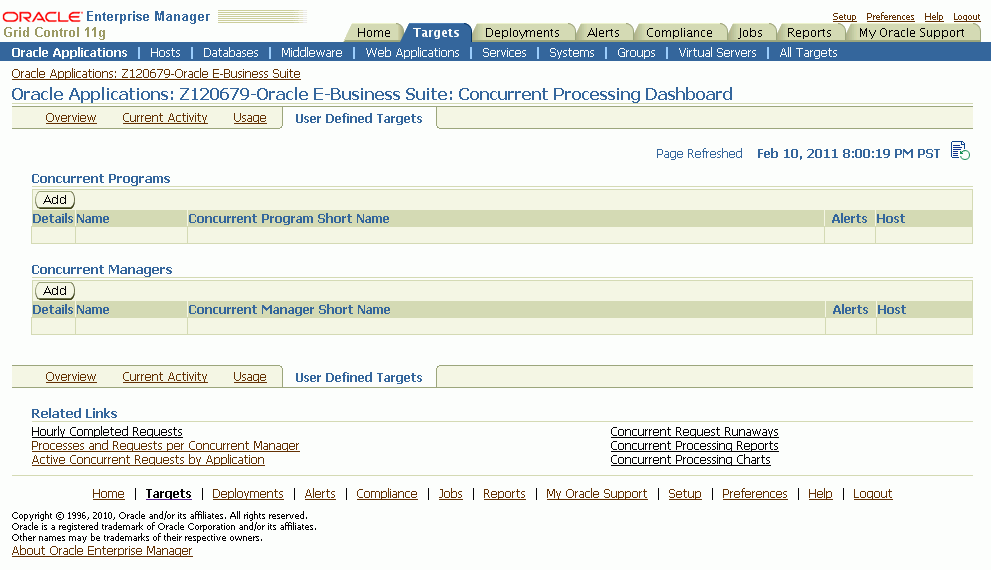
You can add concurrent managers and programs as targets to monitor. Use this tab to get details about these targets as well as add more custom targets.
For custom concurrent program targets, the following columns are shown:
Name
Concurrent Program Short Name
Alerts
Host
Click on "Show" in the Details column to see the following metrics for the given concurrent program target. (More details can be seen from the Target home page > All Metrics):
Number of Concurrent Requests by Status
Number of Hourly Completed Requests
Requests Completed with Error
Long-Pending Requests
Long-Running Requests
Use the Add button under Concurrent Programs to add a new program target.
For concurrent manager targets, the following columns are shown:
Name
Concurrent Manager Short Name
Alerts
Host
Click on "Show" in the Details column to see the following for the given concurrent manager target:
Active Processes
Running Requests
Pending Requests
Use the Add button under Concurrent Managers to add a new manager target.
You can add a concurrent program custom target so that the system will collect metrics on activity and usage for the concurrent program.
To add a concurrent program custom target, navigate to the following: System Management tab > Instance Name > Related Links, Configured Components. From the Configured Components page, select "Concurrent Program" from the dropdown list and click Go.
Alternatively, navigate to the Concurrent Processing Dashboard, User Defined Targets tab, and click Add under Concurrent Programs.
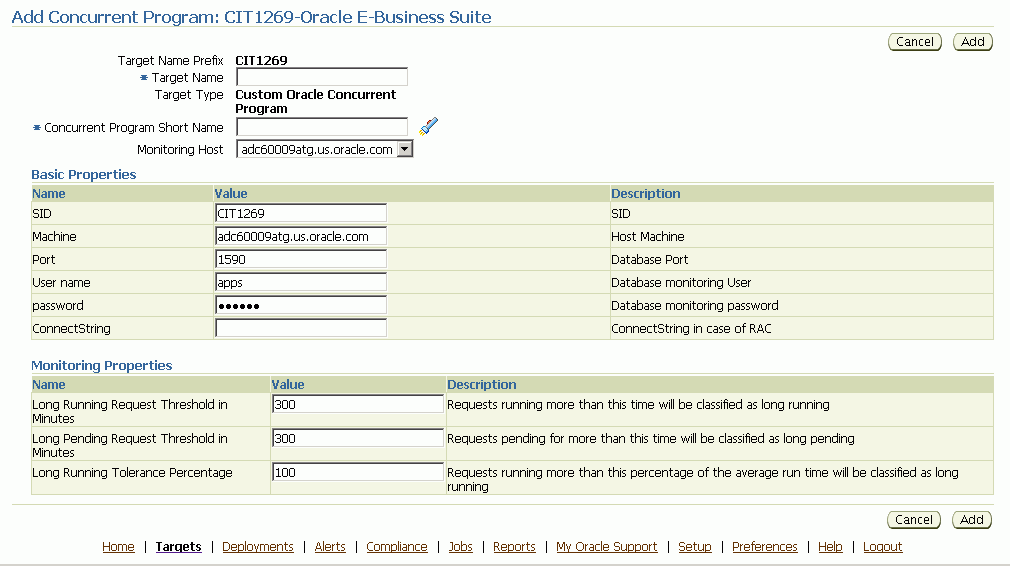
For your new target, define the following:
Target Name Prefix - This value is determined by the system based on the instance name and cannot be updated.
Target Name - Enter in a target name "suffix". The actual target name will be composed of the Target Name Prefix (above) and the value of this field.
Target Type - The system automatically provides the value "Custom Oracle Concurrent Program".
Concurrent Program Short Name - Use the LOV icon to search for and select the program short name. In searching for the program name you can search by concurrent program short name, concurrent program name, or application.
Monitoring Host
For the Basic Properties region, values for the following should default in. These values are used as credentials by the target for metrics collection:
SID
Machine
Port
(Database) User name
(Database) Password
ConnectString
For metrics collection, you need to define the thresholds for several metrics. Define instance parameters that will be used to categorize requests for the following:
A request will be termed Long Pending if it is in Pending status for longer than the "Long Pending Request Threshold In Minutes".
A request will be considered Long Running if it runs for longer than the "Long Running Request Threshold In Minutes" and (1+0.1*"Long Running Tolerance Percentage")*Average Running Time of the Concurrent Program.
When you are done, click Add to add the target.
Once you have added a custom concurrent program target, you can monitor metrics for it.
From the main Administration Dashboard, click on Configured Components under Related Links. Your custom concurrent program target should be listed. Click on its name link to view details.
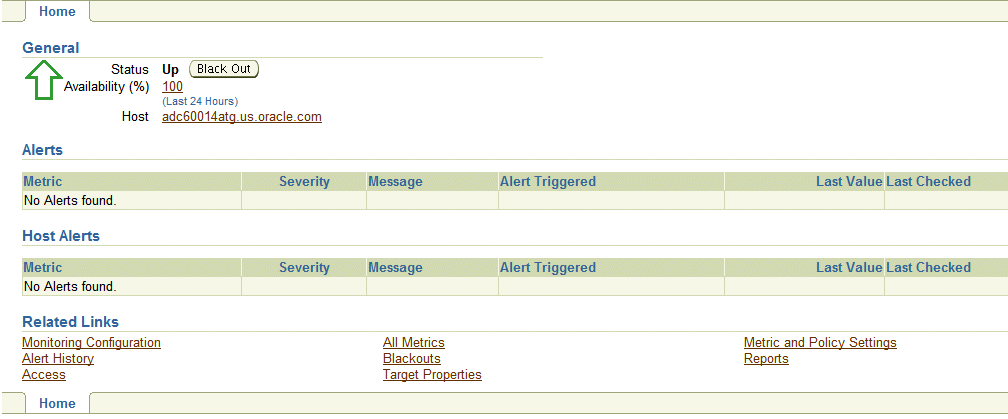
The Home tab has the following regions
General - This region lists the concurrent program target's status and its availability in the past 24 hours. It also provides a drilldown link for its host.
Alerts
Host Alerts
Related Links
Click on the All Metrics link to view the metrics in the following categories: Basic Information, Concurrent Requests by Status, Hourly Completed Requests, Long Pending Requests, Long Running Requests, Pending Requests, Requests Completed with Error, Requests Completed with Warning, Response, and Running Requests.
You can expand on each category using the (+) icon to view records for each by various criteria. For example, to view running requests listed by concurrent program name, click on the (+) icon next to "Running Requests", and then click on "Concurrent Program Name".
You can also click on the category name to view metrics for all records for that category. These metrics are listed below.
This page lists metrics for the following:
Requests Completed Successfully
Requests Completed with Warnings
Requests Completed with Errors
Minimum Run Time
Maximum Run Time
Average Run Time
The numbers for requests in each status below are listed.
Concurrent Requests Pending (Normal)
Concurrent Requests Pending (Standby)
Concurrent Requests Scheduled
Concurrent Requests Inactive (No Manager)
Concurrent Requests Inactive (On Hold)
Concurrent Requests Running
Concurrent Requests Completed Successfully
Concurrent Requests Completed With Warning
Concurrent Requests With Error
Concurrent Requests Successful Requests Rate (%)
Concurrent Requests Warning Rate (%)
Concurrent Requests Error Rate (%)
Request ID
Concurrent Program Short Name
Concurrent Program Name
Request Start Date
Username
Phase
Status
Pending Time
Concurrent Manager
Request ID
Concurrent Program Short Name
Concurrent Program Name
Request Start Date
Username
Phase
Status
Running Time
Concurrent Manager
Request ID
Concurrent Program Short Name
Concurrent Program Name
Request Start Date
Username
Phase
Status
Pending Time
Concurrent Manager
Request ID
Concurrent Program Short Name
Concurrent Program Name
Request Start Date
Username
Phase
Status
Execution Time
Request ID
Concurrent Program Short Name
Concurrent Program Name
Request Start Date
Username
Phase
Status
Execution Time
Request ID
Concurrent Program Short Name
Concurrent Program Name
Request Start Date
Username
Phase
Status
Running Time
Concurrent Manager
You can add a concurrent manager custom target so that the system will collect metrics on activity and usage for requests run by the concurrent manager.
To add a concurrent manager custom target, navigate as follows: System Management tab > Instance Name > Related Links, Configured Components. From the Configured Components page, select "Concurrent Manager" from the dropdown list and click Go.
Alternatively, navigate to the Concurrent Processing Dashboard, User Defined Targets tab, and click Add under Concurrent Manager.
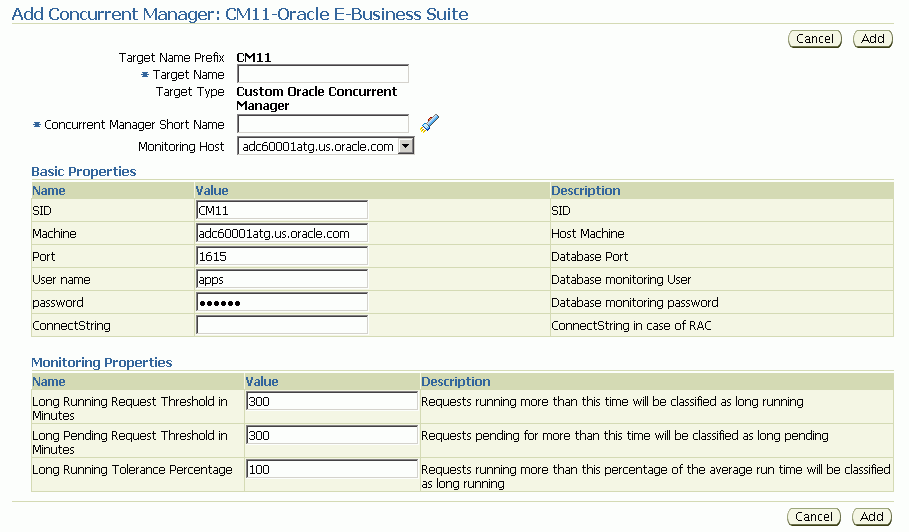
For your new target, define the following:
Target Name Prefix - This value is determined by the system based on the instance name and cannot be updated.
Target Name - Enter in a target name "suffix". The actual target name will be composed of the Target Name Prefix (above) and the value of this field.
Target Type - The system automatically provides the value "Custom Oracle Concurrent Manager".
Concurrent Manager Short Name - Use the LOV icon to search for and select the concurrent manager short name. In searching for the manager name you can search by concurrent manager short name, concurrent manager name, or application.
Monitoring Host
For the Basic Properties region, values for the following should default in. These values are used as credentials by the target for metrics collection:
SID
Machine
Port
(Database) User name
(Database) Password
ConnectString
For metrics collection, you need to specify values for three Instance Properties that will be used to categorize requests for the following:
A request will be termed Long Pending if it is in Pending status for longer than the "Long Pending Request Threshold In Minutes".
A request will be considered Long Running if it runs for longer than the "Long Running Request Threshold In Minutes" and (1+0.1*"Long Running Tolerance Percentage")*Average Running Time of the Concurrent Program.
You can also change these properties by clicking the "Monitoring Configuration" link on the Target Home page.
When you are done, click Add to add the target.
Once you have added a custom concurrent manager target, you can monitor metrics for it.
From the main Administration Dashboard, click on Configured Components under Related Links. Your custom concurrent manager target should be listed. Click on its name link to view details.

The Home tab has the following regions
General - This lists the concurrent manager's status and its availability in the past 24 hours. Its host is also listed with a drilldown link for it.
Alerts
Host Alerts
Related Links
Click on the All Metrics link to view the metrics in the following categories: Active Processes, Pending Requests, Response, and Running Requests.
You can expand on each category using the (+) icon to view records for each by various criteria. For example, to view running requests listed by concurrent program name, click on the (+) icon next to "Running Requests", and then click on "Concurrent Program Name".
You can also click on the category name to view details of all records for that category. These details are listed below.
Target Node
OS Process ID
Session ID
Process Status
Request ID
Concurrent Program Short Name
Concurrent Program Name
Request Start Date
Username
Phase
Status
Pending Time
Request ID
Concurrent Program Short Name
Concurrent Program Name
Request Start Date
Username
Phase
Status
Running Time
Use the "Metric and Policy Settings" link under Related Links to view and edit the metrics collection settings. You can view metric thresholds for all metrics or just those metrics with thresholds that have been set.
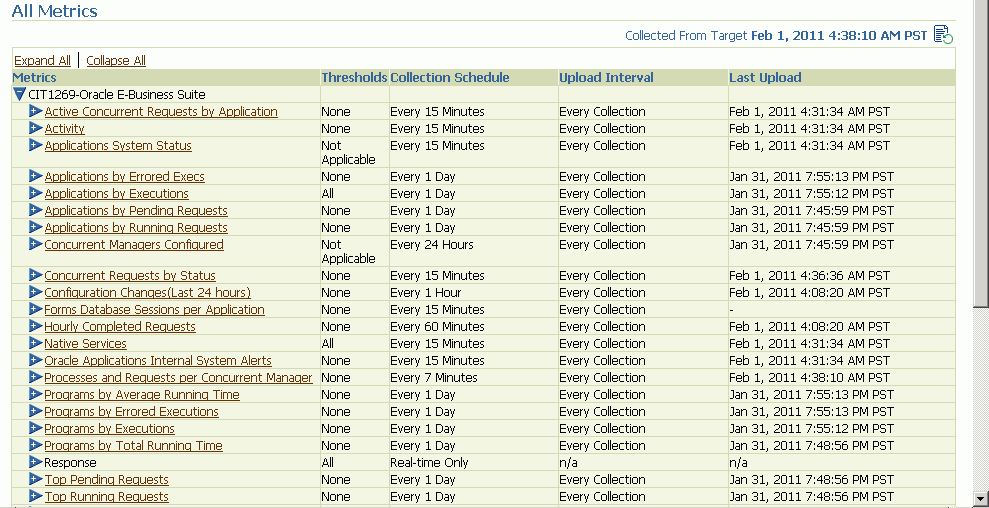
This section lists the concurrent processing metrics available from the All Metrics page. Navigate to the All Metrics page from the Oracle E-Business Suite Instance Home page > All Metrics link (under Related Links).
For each type of metric below, the details listed for each record are shown.
Application Short Name
Application Name
Non-Repeating Pending Requests (Normal and Standby)
Repeating Pending Requests (Normal and Standby)
Non-Repeating Running Requests
Repeating Running Requests
Application Short Name
Application Name
Total Executions
Errored Executions
Errored Executions (%)
Application Short Name
Application Name
Total Executions
Successful Executions (%)
Errored Executions (%)
Application Short Name
Application Name
Number of Pending Requests
Application Short Name
Application Name
Number of Running Requests
Concurrent Program Name
User Concurrent Program Name
Total Executions
Average Running Time
Maximum Running Time
Concurrent Program Name
User Concurrent Program Name
Total Executions
Total Executions (Errored)
Executions Errored (%)
Concurrent Program Name
User Concurrent Program Name
Total Executions
Successful Executions (%)
Errored Executions (%)
Concurrent Program Name
User Concurrent Program Name
Total Executions
Total Running Time
Successful Executions (%)
Request ID
Program Name
Program Short Name
Request Start Date
Pending Time
User Name
Manager Name
Phase
Status
Request ID
Program Name
Program Short Name
Request Start Date
Running Time
User Name
Manager Name
Phase
Status
Request ID
Program Name
Program Short Name
Request Start Date
Scheduled to Run In (Minutes)
User Name
Manager Name
Phase
Status
User Name
Number of Requests
User Name
Number of Pending Requests
User Name
Number of Running Requests
AMP allows you to define parameters for long running and long pending requests. Follow the procedure to do so.
Navigate to the following from the main Administration Dashboard: Performance tab > Concurrent Processing Dashboard > [Concurrent Manager named link] under Components > Edit Oracle Concurrent Manager (link).
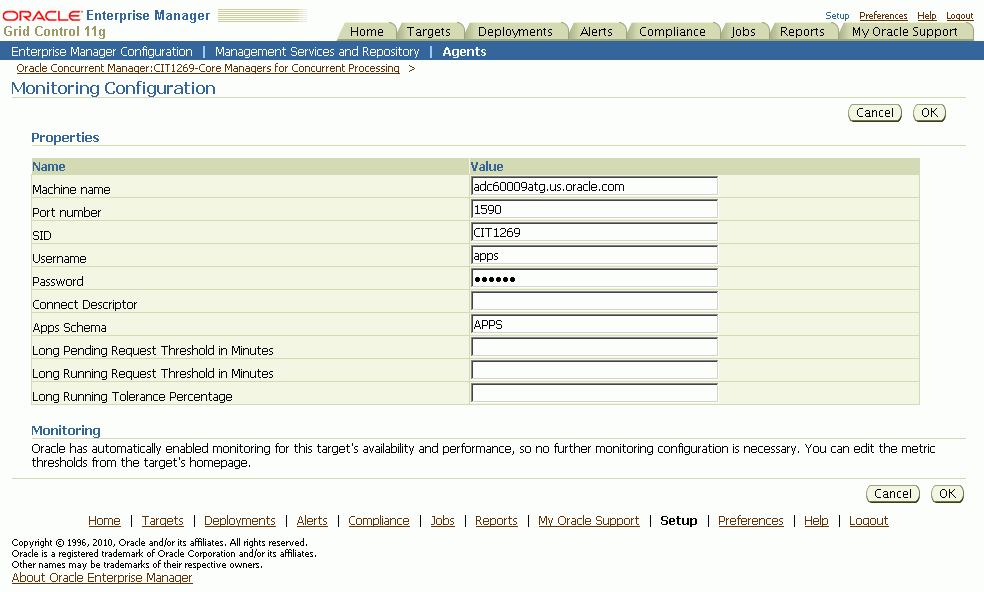
Enter in values for these fields:
Long Pending Request Threshold in Minutes
Long Running Request Threshold in Minutes
Long Running Tolerance Percentage
The three parameters above are instance parameters for categorizing a request as long running or long pending.
A request will be considered long pending if it is pending for more than the "Long Pending Threshold in Minutes" value.
A request will be considered long running if it runs for more than the "Long Running Request Threshold in Minutes" value AND for longer than (1 + 0.01*[Long Running Tolerance Percentage]*[Average Running Time of the Concurrent Program]).
After you have set these parameters, you can go to the All Metrics page to see these categories listed. Navigate to the All Metrics page from the Concurrent Processing Dashboard > All Metrics link (under Related Links).
For Long Pending Requests, the following details are available through drilling down:
Request ID
Concurrent Program Short Name
Concurrent Program Name
Request Start Date
Username
Phase
Status
Pending Time
Concurrent Manager
For Long Running Requests, the following are available through drilling down:
Request ID
Concurrent Program Short Name
Concurrent Program Name
Request Start Date
Username
Phase
Status
Running Time
Concurrent Manager
For Long Running and Long Pending Requests, you can drill down to get a count for each.
Under Related Links on the same All Metrics page, click on Metric and Policy Settings to edit the alert threshold for long pending and long running requests. Choose to view "All Metrics" from the View dropdown list and set the alerts count for Long Pending Requests and Long Running Requests.
![]()
Copyright © 2007, 2011, Oracle and/or its affiliates. All rights reserved.