Release 4.0
Part Number E18709-01
Contents
Previous
Next
| Oracle Application Management Pack for Oracle E-Business Suite User's Guide Release 4.0 Part Number E18709-01 | Contents | Previous | Next |
Grid Control allows you to monitor multiple Oracle E-Business Suite systems from a single console and to drill down into Oracle Applications Manager where you can control, configure, troubleshoot, and maintain individual systems. Once you have registered your Oracle E-Business Suite systems, you can start using the features of Grid Control for managing those systems.
The Oracle Application Management Pack for Oracle E-Business Suite provides a new Oracle Applications subtab under the Targets tab of Grid Control. You can enable or disable this subtab, depending on your preferences. By default, this new subtab is enabled only for the SYSMAN user.
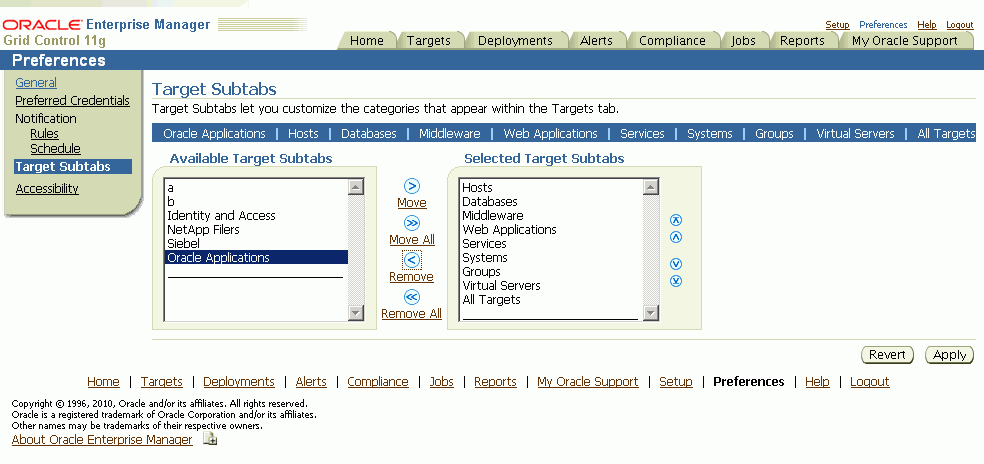
To enable the subtab:
Click on the global Preferences link in Grid Control.
Select Target Subtabs from the menu on the left of the page.
Choose Oracle Applications from the Available Target Subtabs list.
Click Move to move your selection to the Selected Target Subtabs list.
When using the Oracle Application Management Pack for Oracle E-Business Suite, you will need to access Oracle E-Business Suite instances. You can set up credentials for these instances as a one-time setup step instead of entering them every time you need to access an instance.
Use the following steps to set up credentials:
Within Oracle Enterprise Manager, select the Preferences global link.
Select Preferred Credentials.
Select the Set Credentials icon to set the credentials for target types "Oracle E-Business Suite Infrastructure" and "Oracle E-Business Suite".
Set the values as needed in the resulting page.
Access the Oracle Applications page by clicking on the Oracle Applications subtab under the Targets tab in Grid Control.
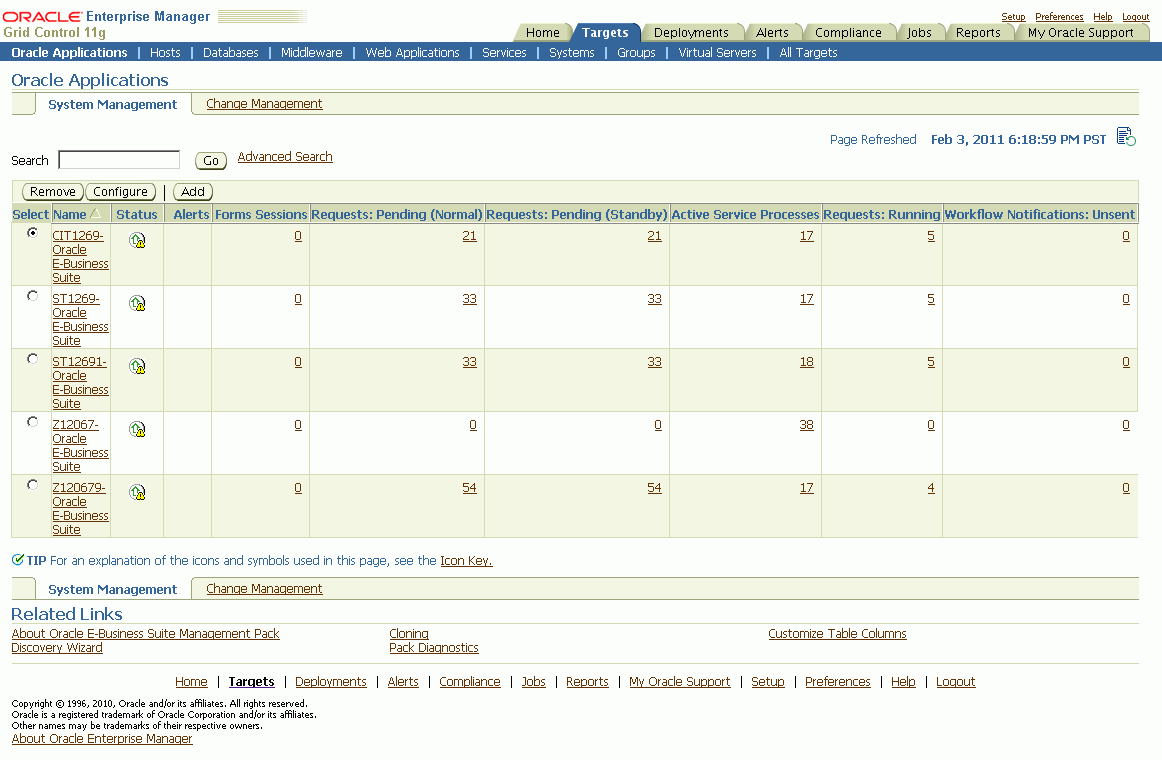
This page provides an overview of the Oracle E-Business Suite systems that have been registered with Grid Control. You can register a new system by clicking Add, and following the directions in the section Discovering Oracle E-Business Suite Systems with Grid Control. You can remove an Oracle E-Business Suite system from Grid Control by selecting the desired system in the table, and then clicking Remove. You can also edit the monitoring configuration of a system by selecting the desired system in the table, and then clicking Configure.
The Oracle Applications page summarizes the status of each Oracle E-Business Suite system that has been registered with Grid Control. For each system, the page also provides a set of metrics that summarize aspects of system usage and performance. You can drill down on the Oracle E-Business Suite system Name to access the home page for that system. You can also drill down on any summary metric to view the historical values of that metric.
This page also provides you with links to additional features:
About Oracle E-Business Suite Management Pack
Cloning - Described in a later chapter.
Customize Table Columns - Described in the section below.
Discovery Wizard - Described in an earlier chapter.
Pack Diagnostics - Described in this chapter.
Also, you can click on the Change Management tab to access the features of the Oracle Application Change Management Pack for Oracle E-Business Suite.
You can configure the summary metrics that are displayed in the Oracle Applications page by clicking on the Customize Table Columns link.
Use the shuttle control to select the summary metric columns that you would like to appear in the Oracle Applications page.
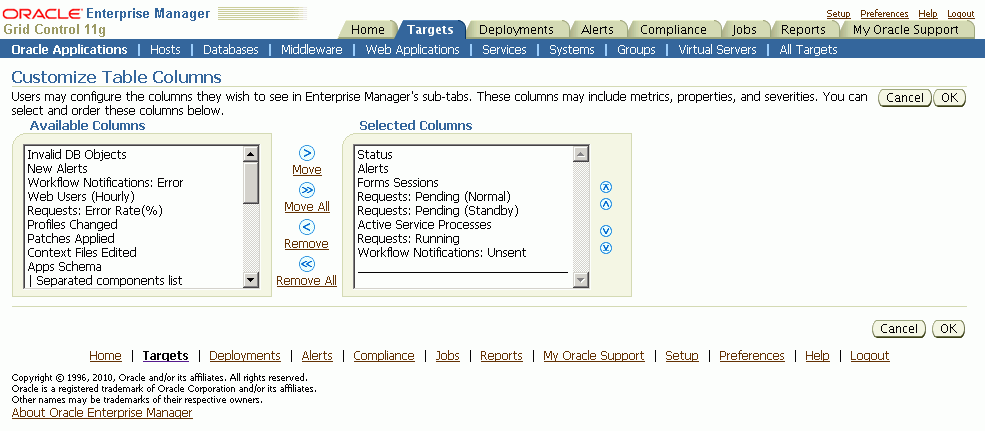
Descriptions of the available "summary" metric columns can be found in the next section.
Use the Pack Diagnostics link to run diagnostic tests on the various features of the Oracle E-Business Suite management packs.
Available tests are divided into the following categories:
AMP: Cloning
Setup Manager
Patch Manager
Customization Manager
User Monitoring
Related Topics
Oracle Application Change Management Pack for Oracle E-Business Suite User's Guide
Navigating the Diagnostics Dashboard
Click on the Pack Diagnostics link under Related Links on the Oracle Applications page.

The resulting Diagnostics dashboard page lists any previous requests to run diagnostic tests.
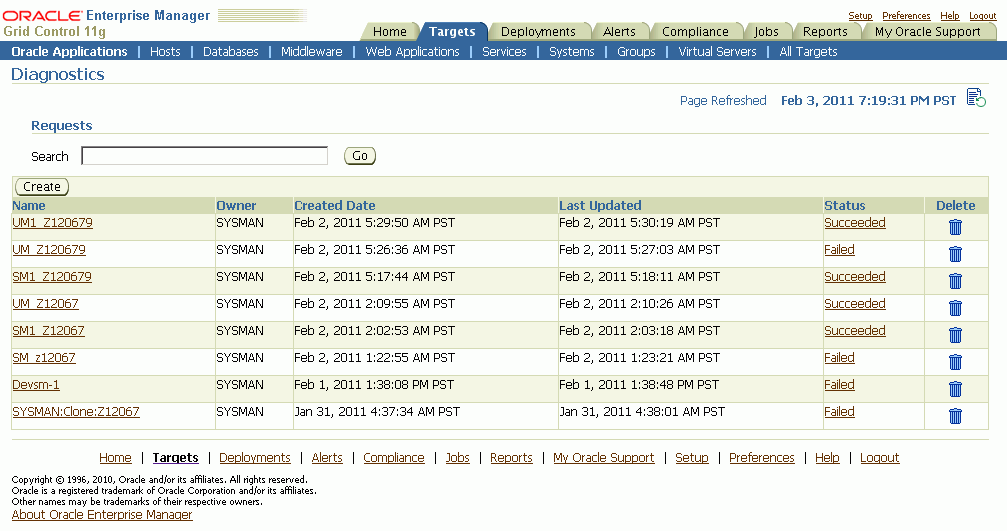
Use the Search feature to search for a Diagnostics request based on your search criteria.
Create a new request using the Create button, as described below.
The requests table lists the following for each request:
Name - User-defined name of the diagnostic test request.
Owner - This value indicates the Enterprise Manager user who submitted the request.
Note: Currently, only those requests submitted by the user currently logged in are shown.
Created Date - The date and time the request was submitted.
Last Updated - The date and time of the last update for the transaction.
Status - The status of the transaction's job. This value is a link to the Enterprise Manager Job execution summary page.
Delete link - Use the Delete link to delete the diagnostics test request transaction.
Creating a request to run diagnostic tests
To request to run a diagnostic test, click the Create button on the Diagnostics dashboard. The Create Request page appears.
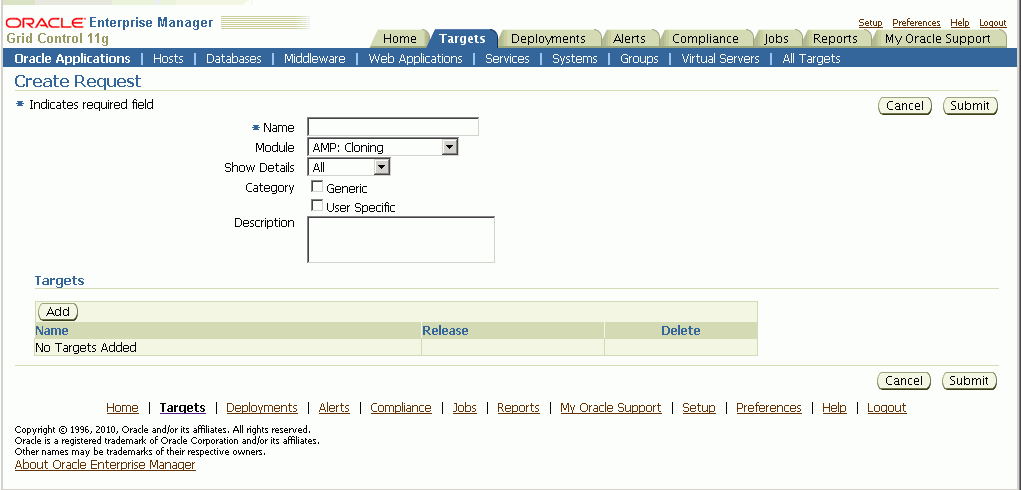
Enter the following details for your request for a diagnostic test.
Enter a name for your request.
Choose the set of tests for one of the following modules: AMP: Cloning, Setup Manager, Patch Manager, Customization Manager, or User Monitoring.
You have two options for logging the details.
All - This option logs all information regardless of whether the diagnostic test completes with success or error
Error - Only log details for those tests that error out.
For Category, choose "Generic" if you want to run the tests that pertain to the Oracle E-Business Suite target and Enterprise Manager Grid Control, in which the test results would not depend on the Enterprise Manager user.
Choose "User Specific" for all the tests that depend on the Enterprise Manager user who is currently logged in.
Optionally enter a Description.
Add Targets for your request using the Add button.
Use the LOV to select your target.
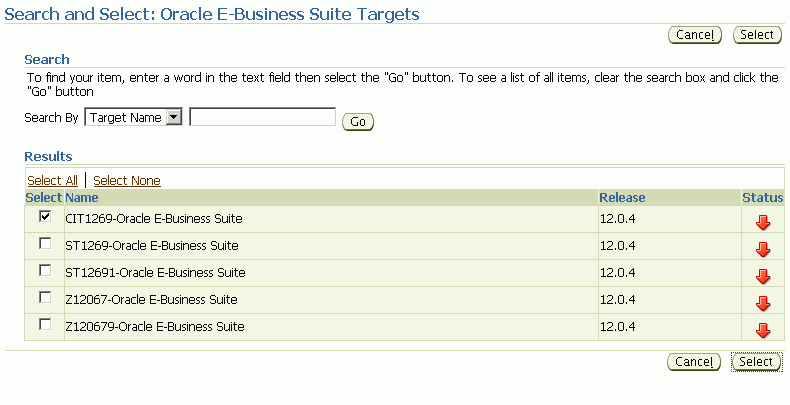
Click the Submit button.
On the main Diagnostics page, you can monitor your request.
The Status column shows the status of your request.
If you want to delete your request, click on the Delete icon for the request.
You can click on the request's Name link to view details for the request.
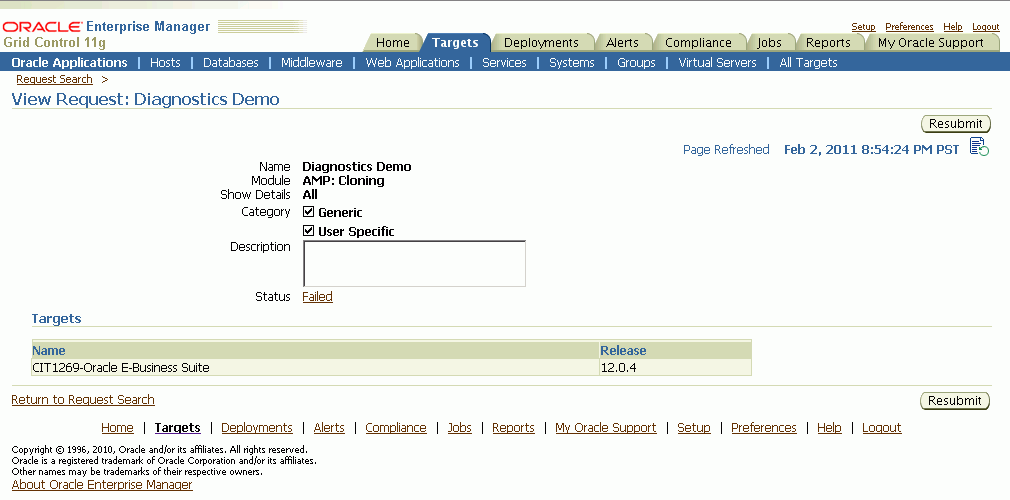
From this page you can resubmit the request using the Resubmit button.
Click on the Status link to drill down to details on the diagnostics job, as well as the log file with the results from the diagnostic tests.
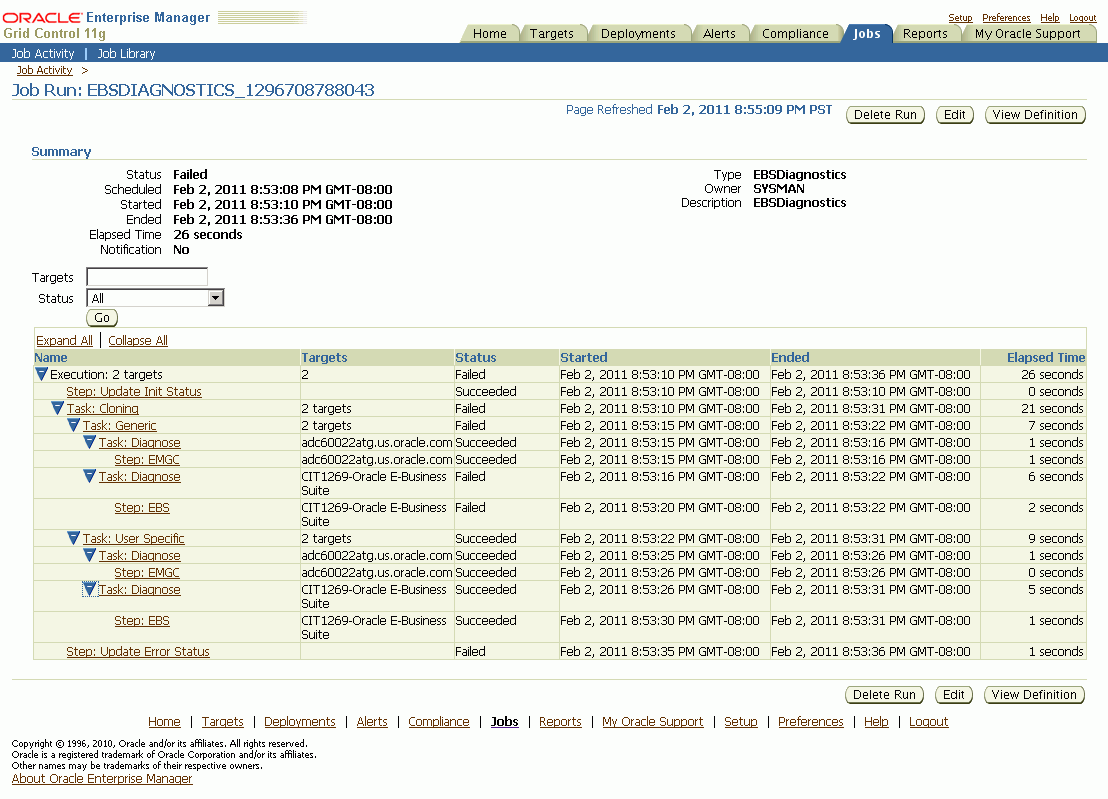
The job execution page lists the name of the module for which the diagnostic tests are submitted; for example, "Task: Cloning".
The "Task: Generic" step includes 2 major steps:
Task Diagnose: Step EMGC - This step would run all Generic tests pertaining to Enterprise Manage Grid Control. The OMS host is listed as the target.
Task Diagnose: Step EBS - This step would run all the Generic tests pertaining to the Oracle E-Business Suite instance. This step would repeat if you requested the tests to run against more than one Oracle E-Business Suite target. The Oracle E-Business Suite targets are listed.
The "Task: User Specific" step includes 2 major steps:
Task Diagnose: Step EMGC - This step would run all user-specific tests pertaining to Enterprise Manage Grid Control. The OMS host is listed as the target.
Task Diagnose: Step EBS - This step would run all user-specific tests pertaining to the Oracle E-Business Suite instance. This step would repeat if you requested the tests to run against more than one Oracle E-Business Suite target. The Oracle E-Business Suite targets are listed.
The home page for an individual Oracle Applications system can be reached by drilling down from the Oracle Applications page as described in the section above. You can also reach the home page by drilling down on the desired Oracle Applications system target in the All Targets page and in other pages of Grid Control.
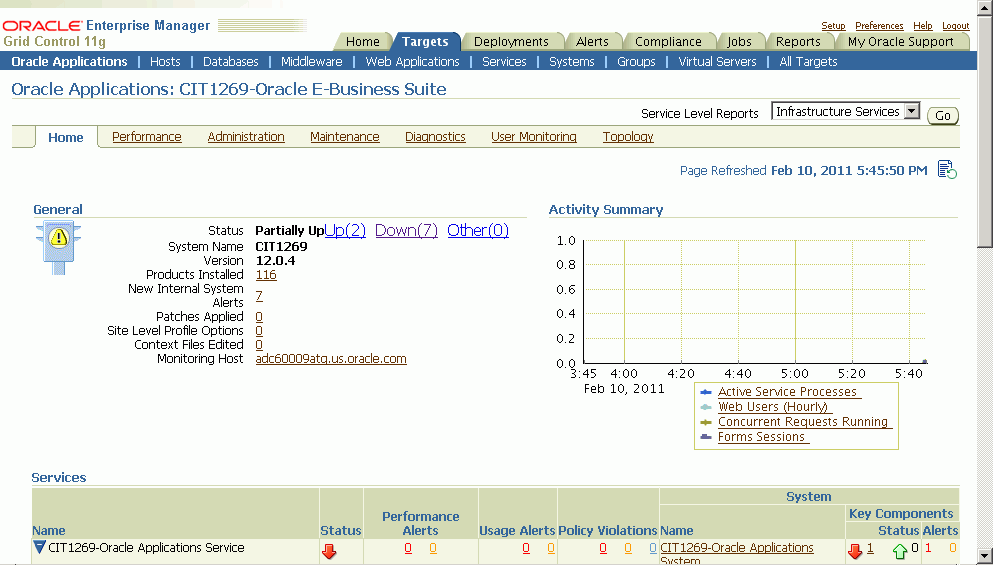
The Oracle Applications System home page provides an overview of the status of a single Oracle Applications system. This page is divided into the following sections:

The General section provides general status and configuration information, including:
Status - The status of the Oracle Applications system, calculated based on the availability of its member targets that contribute to its availability definition. In addition to the current status of the system, you can see the counts of member targets that fall into the status categories of Up, Down, or Other. You can drill down on a status category to view the targets that currently fall into that category.
Note: When an Oracle E-Business Suite instance is brought down on both the middle tier and the database tier, the following 3 targets will be listed with the status of Other, with metric collection errors:
Concurrent Processing Service
Internal Concurrent Manager
Workflow Service
When Enterprise Manager encounters an error during the collection of the metric "Response (Status)" for any target, it retains the error until it is cleared.
System Name - The system name that was entered when the system was registered as described in the section above.
Version - The current release level of the Oracle Applications system. The level is set at installation time, and is updated when Maintenance Packs are applied. Please note that family packs, mini-packs, and individual patches do not update this version number. The actual patch levels of individual products may be more recent than the system version.
Products Installed - This indicates the number of products that are installed in the Oracle Applications system. If the Oracle Applications Enterprise Manager interoperability patch has been applied to the managed system, then you can drill down on this value into Oracle Applications Manager, where you can view the list of products installed, and the patch levels of those individual products.
New Internal System Alerts - This metric is only available when the Oracle Applications Enterprise Manager interoperability patch has been applied to the managed system. This metric shows the number of System Alerts within Oracle Applications Manager that have a status of New. You can drill down on this number to view the details in Oracle Applications Manager. Note that these System Alerts originate from within the Oracle Applications System itself, and are complementary to the Oracle Enterprise Manager alerts discussed below. For more information on System Alerts, please see the Oracle Applications Manager online help.
Patches Applied - This metric is only available when the Oracle Applications Enterprise Manager interoperability patch has been applied to the managed system. This metric indicates the number of patches that have been applied to the system in the last 24 hours. You can drill down on this metric to view the patches in Oracle Applications Manager.
Site Level Profile Options Changed - This metric indicates the number of site level profile options that have changed on the system in the last 24 hours. You can drill down on this metric to view the site level profile options in Oracle Applications Manager. (Note: For Release 11i, this metric is available only when the Oracle Applications Enterprise Manager interoperability patch has been applied to the managed system. See My Oracle Support Knowledge Document 1224313.1 for information on required patches.)
Context Files Edited - This metric is only available when the Oracle Applications Enterprise Manager interoperability patch has been applied to the managed system. This metric indicates the number of AutoConfig context files that have changed on the system in the last 24 hours. You can drill down on this metric to view the context files in Oracle Applications Manager.
Monitoring Host - The host of the agent that is monitoring the Oracle Applications system. This host was selected when the Oracle Applications system was registered as described in the section above. You can drill down on the host name to reach the Grid Control home page for the host.
The New Internal System Alerts, Patches Applied, Site Level Profile Options Changed, and Context Files Edited metrics are based on information periodically summarized in the Oracle Applications database by the Oracle Applications Manager Dashboard Collection concurrent program. This program is controlled through the Preferences global link in Oracle Applications Manager. If this program has been disabled in the Oracle Applications system for some reason, then these metrics will not be updated.
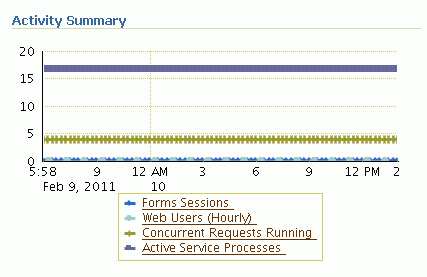
The activity summary provides an overview of system activity for the last 24 hours including:
Form Sessions - This metric indicates the number of open Form sessions on the system at a given point in time.
Note: To enable Oracle Applications Manager and Grid Control to collect this metric, set the profile option Sign-on: Audit Level to "Form" in the target Oracle Applications system.
Web Users (Last Hour) - This metric measures the number of distinct users to access Oracle Applications HTML pages during the previous hour.
Concurrent Requests Running - This metric indicates the number of concurrent requests running on the system at a given point in time.
Active Service Processes - The meaning of this metric differs depending on whether or not the Oracle Applications Enterprise Manager interoperability patch has been installed on the target system. If the interoperability patch has been applied, then this metric indicates the number of active application tier processes that are running under the Generic Service Management feature of Oracle Applications Release 11i. This metric includes concurrent processing infrastructure processes, Workflow Mailer processes, and more. If the interoperability patch has not been applied to the target system, then this metric indicates only the number of active concurrent processing infrastructure processes on the application tier. The concurrent processing infrastructure includes concurrent managers, transaction managers, service managers, the Internal Concurrent Manager, the Conflict Resolution Manager, and the Scheduler.

Using the Service Level Management feature with Enterprise Manager Grid Control, Oracle Applications middle tier components can be monitored for their availability and performance. The middle tier components, being the infrastructure for Oracle Applications, are monitored not only for their key processes but also for all the other components on which they are dependent.
The Oracle Applications Infrastructure service is defined by the following:
Concurrent Processing Service - This service provides a summary of the availability and performance of concurrent processing within Oracle Application.
Forms Applications Service - This service provides a summary of the availability and performance of Oracle Forms within Oracle Applications.
Self-Service Applications Service - This service provides a summary of the availability and performance of Oracle Application Framework pages within Oracle Applications.
Workflow Service - This service provides a summary of the availability and performance of Oracle Workflow within Oracle Applications.
The following table provides details of the core service/component that’s being monitored as part of the infrastructure service and also the key components on which the core service is dependent.
| Infrastructure Service | Core Service / Component Monitored | Key Components |
| Concurrent Processing Service | Internal Concurrent Manager |
|
| Forms Application Service | OC4J Forms Server |
|
| Self Service Application Service | OC4J (Oracle Application Framework) |
|
| Workflow Service |
|
|
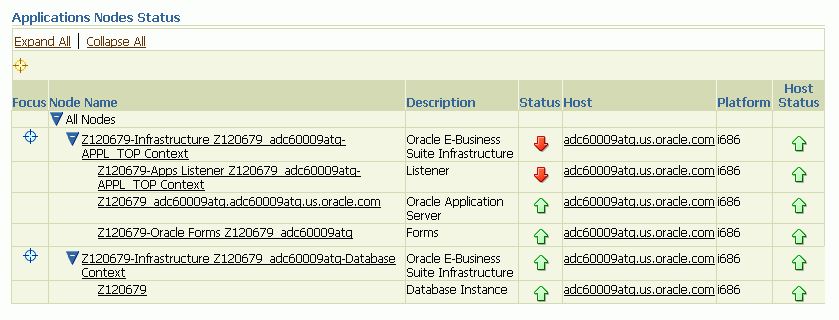
The Application Node Status provides a summary of the availability statuses of various components such as Forms, Applications Listener, Application Server and Database Instance. The availability status information is summarized at the node level. The host details such as host name, platform and the host status are available for each component.
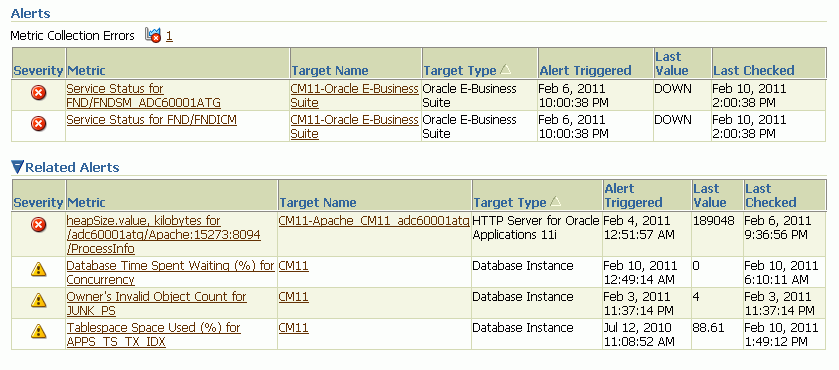
The Alerts section provides an overview of the Alerts posted by Oracle Enterprise Manager for targets that have become unavailable, or for metrics that have exceeded specified thresholds. The Alerts table shows alerts specifically for the Oracle Applications system target.
The Related Alerts table shows alerts for all targets that were registered as members of the Oracle Applications system but being monitored separately outside the pack.
You can drill down to view the details of an alert by clicking on the corresponding name in the Metric column. You can drill down to the related target’s home page by drilling down on the Target Name. To define an alert metric threshold for alerting, click the Edit Metric Thresholds link under Related Links at the bottom of the page. For more information on metrics and alerts, please see the Enterprise Manager 10g Grid Control documentation.
Related Links include:
All Metrics
Metric Thresholds
Target Properties
Monitoring Configuration
Alerts History
Configured Components
Oracle Applications Manager
Most of these links and their features are described in the Oracle Enterprise Manager documentation.
The Configured Components page lists each component, its status, number of alerts, and component type. You can drill down to more details on each component, its status, and alerts using the links provided.
The Oracle Applications Manager (OAM) link opens a new browser window for OAM in the Oracle E-Business Suite; OAM is described in the Oracle E-Business Suite System Administrator's Guide Documentation Set.
The Oracle Applications System Performance page pulls together key usage and performance indicators for the system in general, and for each tier of the system. You can change views using the View list. Four views are provided:
Activity
Applications Server
Database
All
Each view provides a set of charts. You can control the period of time depicted by the charts using the View Data list.
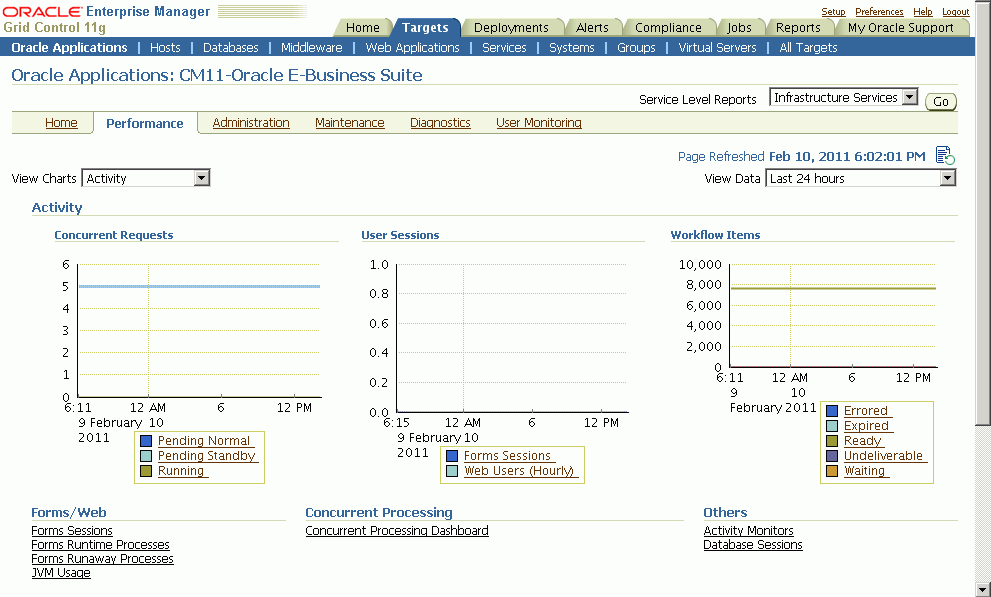
The Oracle Applications System view provides an overview of key system-wide metrics. This view contains the following three charts:
Concurrent Requests - This chart depicts the concurrent request load on the system. The chart shows the numbers of Pending Normal, Pending Standby, and Running concurrent requests at each point in time.
User Sessions - This chart depicts the end user activity on the system. The chart shows the number of Oracle Forms sessions active at each point in time. Also, the chart shows the count of users who have accessed the HTML-based applications over hourly intervals.
Workflow Items - This chart depicts the messaging activity in Oracle Workflow's Business Event System. The chart shows the count of messages by status for each period of time.
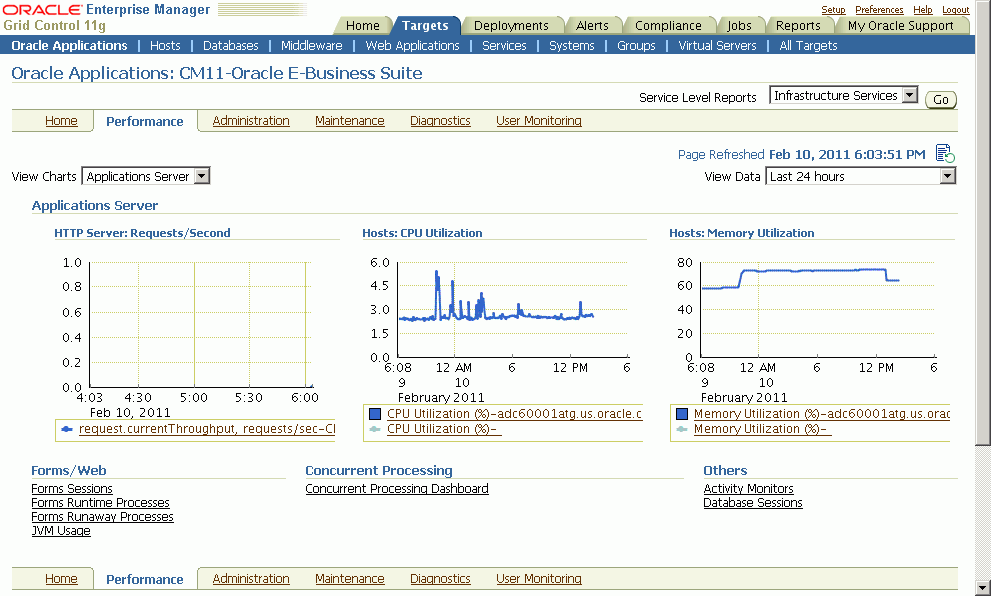
The Applications Server view shows key middle tier usage and performance metrics for the Oracle Applications system. This view provides the following three charts:
HTTP Server: Requests/Second - This chart depicts the throughput of the HTTP Server at each point in time. Multiple HTTP servers are represented by different lines in this graph.
Hosts: CPU Utilization - This chart depicts the CPU utilization on each Applications Tier host. Multiple hosts are shown as different lines in this graph.
Hosts: Memory Utilization - This chart depicts the memory utilization on each Applications Tier host. Multiple hosts are shown as different lines in this graph.
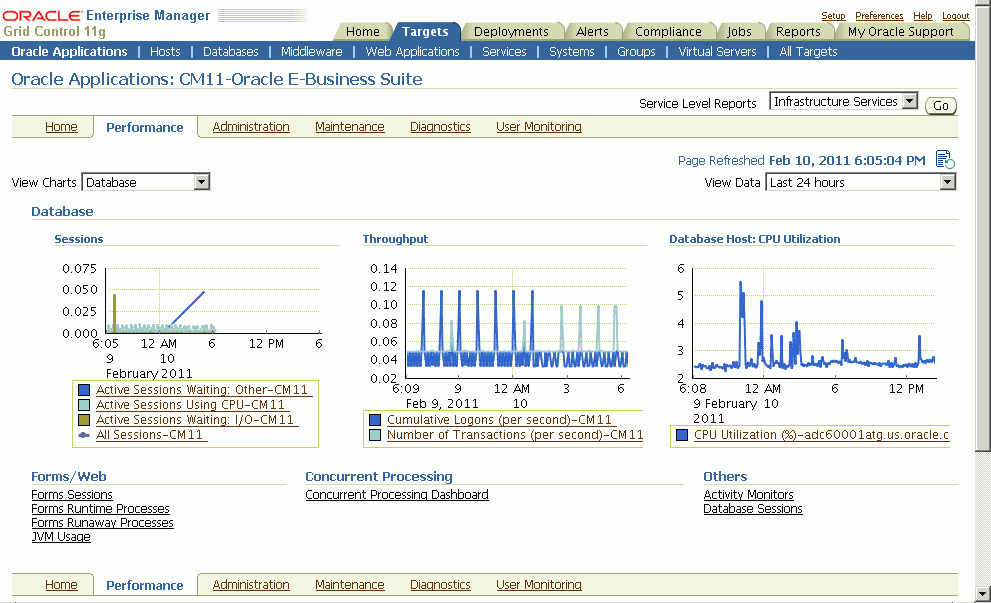
The Database tier view shows usage and performance metrics for the Oracle Applications system database and its hosts. This view provides the following three charts:
Sessions - This chart breaks down the database session usage. The data points include the total count of database sessions, the count of active sessions using CPU, the count of active sessions waiting on I/O, and the count of active sessions waiting on other resources.
Throughput - This chart provides two indicators of database throughput: the number of transactions per second and the number of logins per second.
Database Hosts: CPU Utilization - This chart depicts the CPU utilization on each database tier host. Multiple hosts are shown as different lines in this graph.
The Oracle Application System JVM usage summary can be viewed from the Performance page. Click the JVM Usage link available under the heading Forms/Web.

The JVM usage information is available across all the multiple nodes. The following metrics are collected as part of the JVM Usage:
Application Module pool - Provides information about all the active and leaked Application Modules.
Locked AOLJ Connections - Provides information about all the locked and leaked AOL/J connections utilized by applications.
Cache Components - Provides information about the cache component utilization by Oracle Application Framework.
For Release 12 systems, in order to enable collection of the data for Application Modules, AOL/J Connection, and Cache Components columns, please ensure that you have set up the monitoring configuration for each "oacore" OC4J target as follows:
For each "oacore" OC4J target click on the name link. The oacore OC4J targets are named in <context_name>.<hostname>_oacore format and are parent targets of each JVM target.
On the home page of the oacore OC4J target, click on "Monitoring Configuration" link under the Related Links section.
Enter the OC4J administrator username and password for the "oacore" OC4J in the "Username for Basic authorization" the "Password for Basic authorization" fields respectively. Please refer to the note below to determine the values for these fields.
Click on OK to save the information.
Note: The OC4J administrator username by default is "oc4jadmin" and is specified in the system-jazn-data.xml file under the $INST_TOP/ora/10.1.3/j2ee/oacore/config directory. The oc4jadmin password by default is set to a randomized value during install and will need to be reset as follows:
In the $INST_TOP/ora/10.1.3/j2ee/oacore/config/system-jazn-data.xml file, set the value of the "credentials" element for oc4jadmin user to your chosen password preceded by a ! character. For example:
<user>
<name>oc4jadmin</name>
<display-name>OC4J Administrator</display-name>
<description>OC4J Administrator</description>
<credentials>!welcome</credentials>
</user>
After saving system-jazn-data.xml restart the oacore OC4J. This will encrypt the updated password in system-jazn-data.xml.

For both Release 11i and Release 12, ensure that the Application Server passwords are set as well, because Oracle Enterprise Manager expects these passwords to be set for metrics collection for the JVM targets.
The Oracle Applications System Performance page provides seamless integration to performance pages within Oracle Applications Manager (OAM). You can use the links provided to access the performance metrics within OAM.
The Oracle Applications System Administration page provides seamless integration with all the administrative activities within Oracle Applications Manager (OAM). Click on the icon in the "Administer" column to navigate to a feature's OAM administrative page.
Configuration reports of the middle-tier components can be accessed from this page using the icons in the "Reports" column.
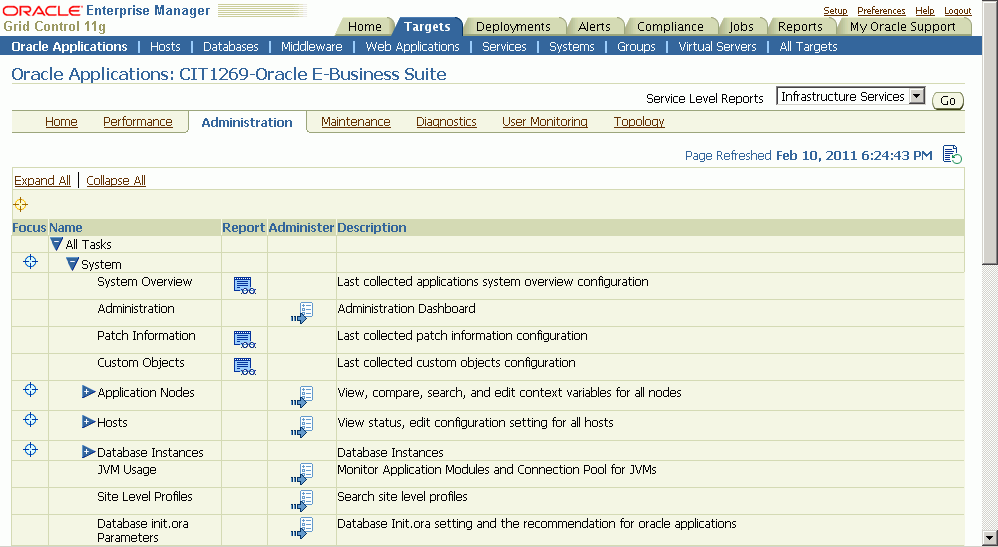
This section describes the various configuration reports accessible from the Administration page.
Note: On the entire configuration reports page, you can perform the following actions:
Save - You can save the current configuration snapshot for either comparing with other reports or for viewing historical changes.
Compare - You can compare the configuration information with that of the same system, saved at an earlier time, or with information of another system.
Compare with Multiple - You can compare the configuration information of a system with multiple other systems (being monitored using Grid Control).
History - You can view the change history of the configuration.
Refresh - You can refresh the configuration report to reflect the latest data.
The Oracle E-Business Suite system configuration can be accessed from the Administration tab. Click on the icon in the Reports column for System Overview.
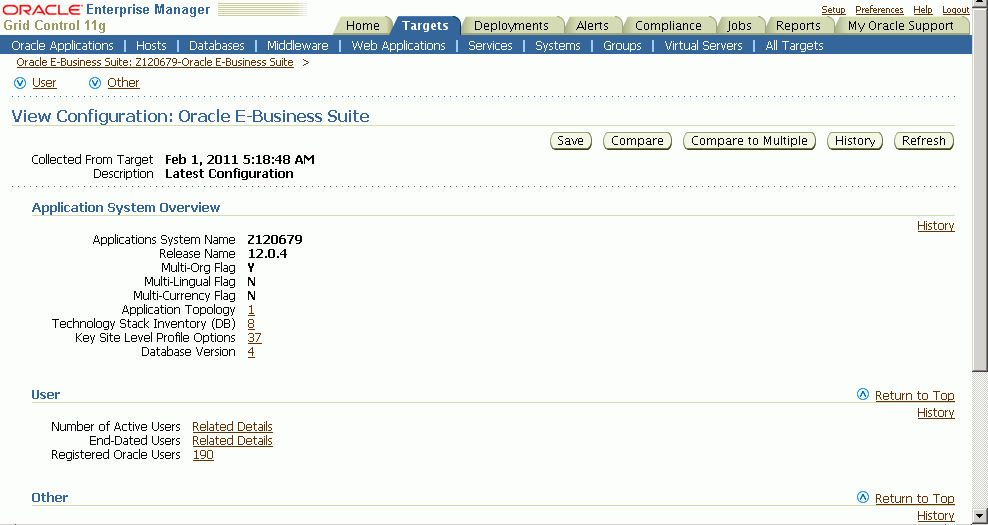
The System Overview view is broken into three sections:
Application System Overview Summary
User Summary
Other Summary
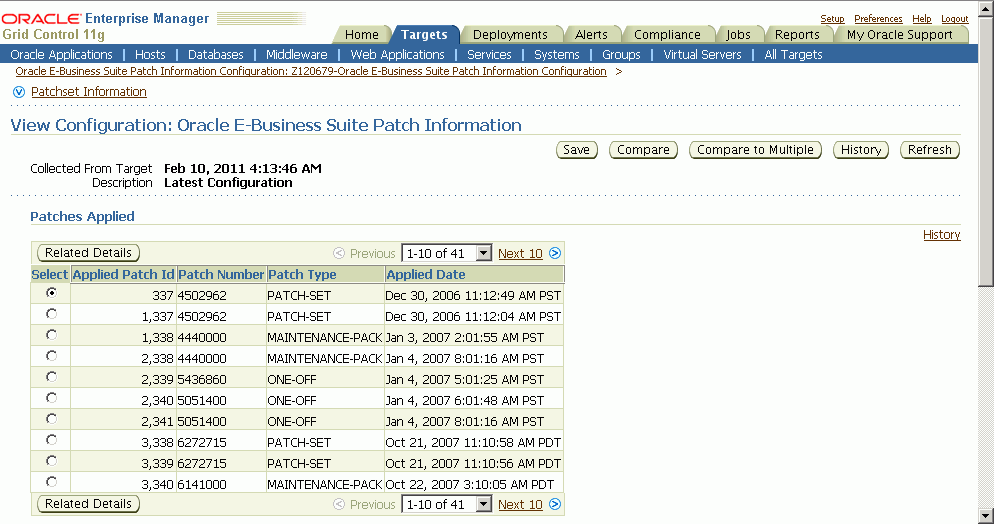
The Patch Information view provides information about all the patches that have been applied to the Oracle E-Business Suite system.
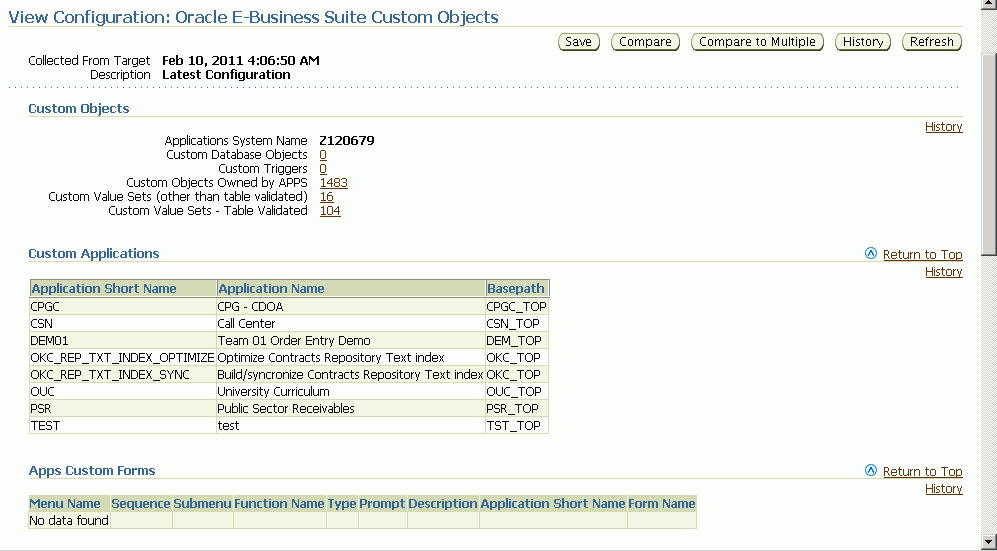
In the custom objects view you can see all the Oracle E-Business Suite customizations.
The Oracle E-Business Suite applications context files can be accessed from the Administration tab.
To view the context file for the application tier, expand "Application Nodes" in the table, then click the icon in the Report column for "APPL-TOP Context".
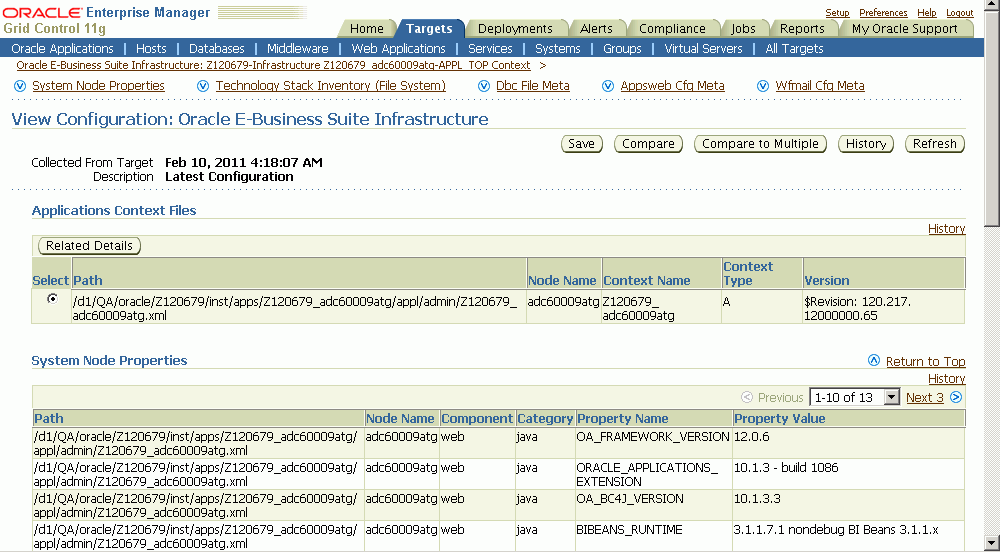
Next select the appropriate context file and click Related Details button to view the context file.
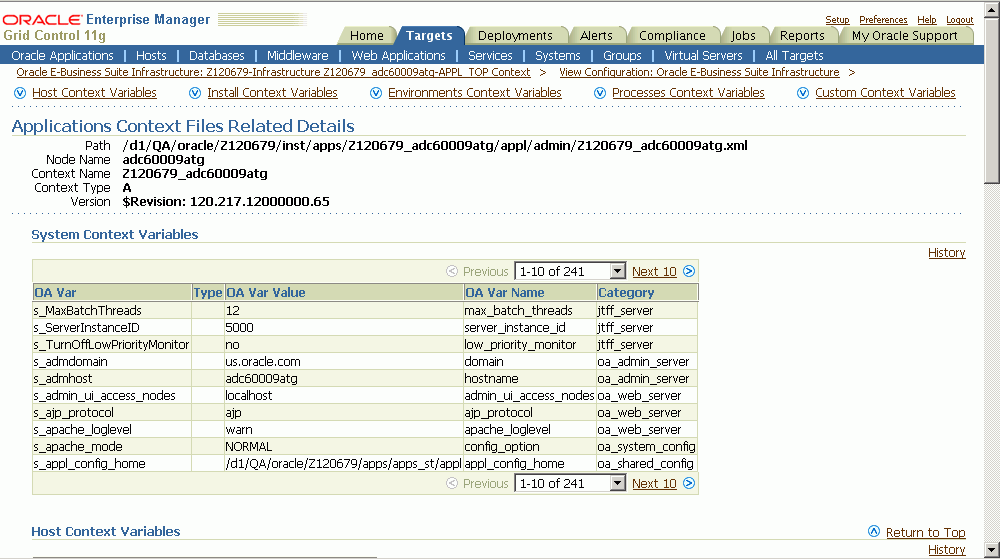
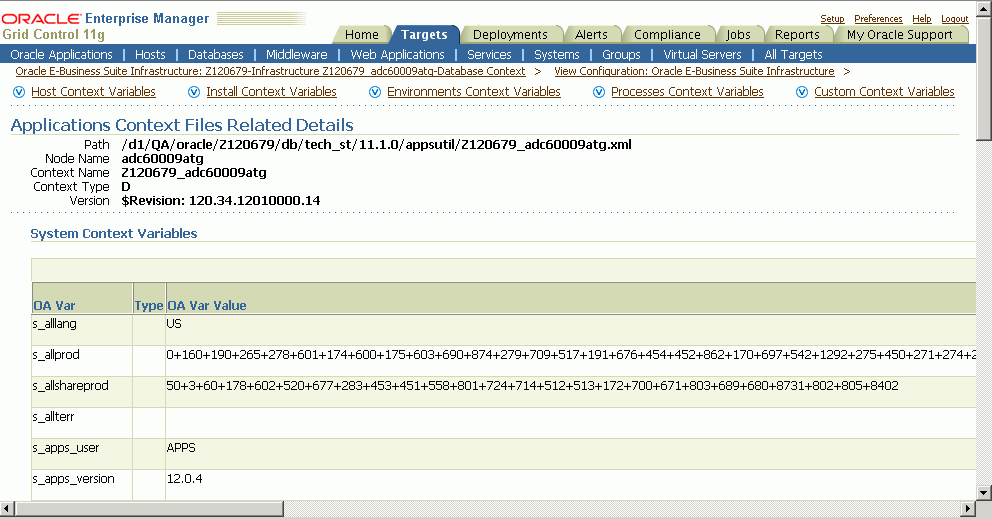
To view the context file for the database tier, click the icon in the Report column for "Database Context".
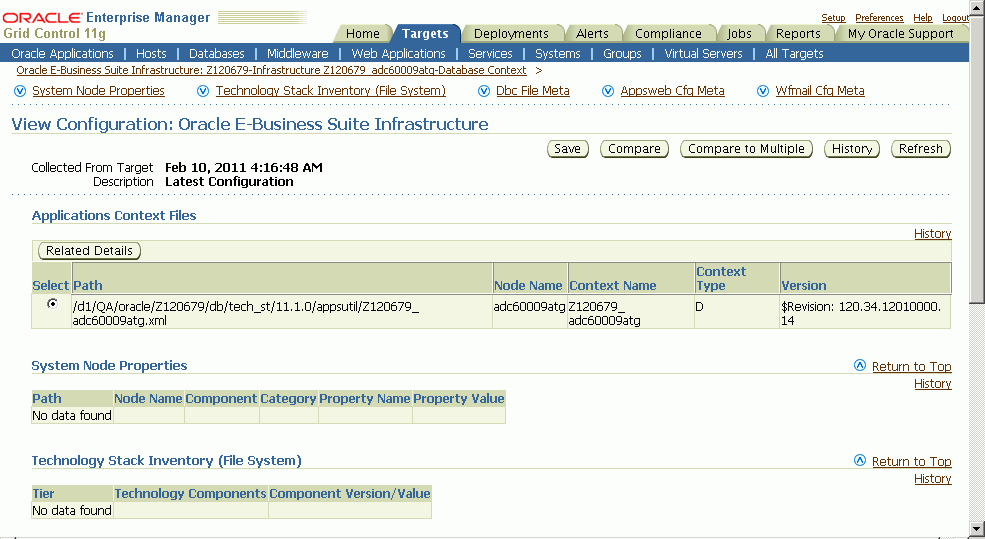
Next select the appropriate context file and click the Related Details button to view the context file.
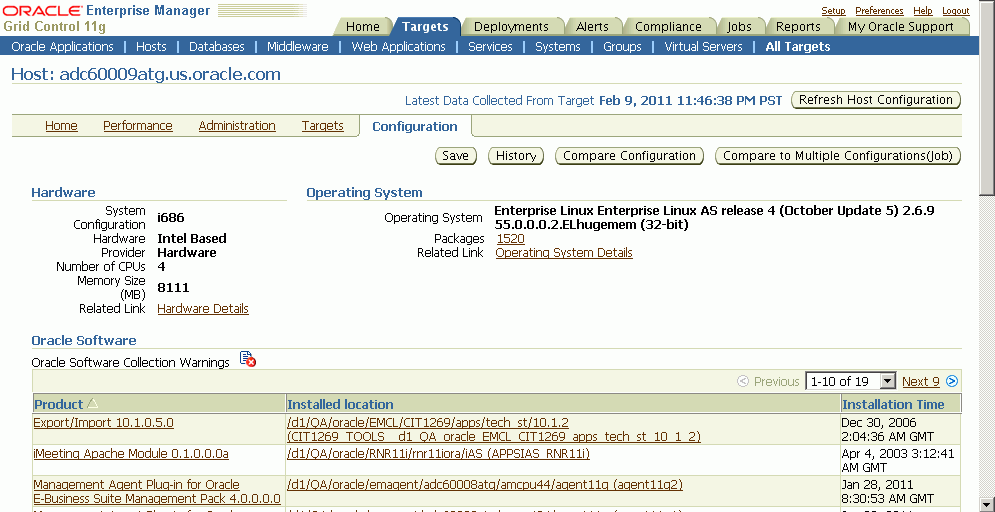
The host configuration details can be accessed from the Administration tab. Expand the "Hosts" heading to view a listing of individual hosts; then for each host, click on the icon under the Report column to view its details.
You can view the configuration information of the hardware, operating system, Oracle software (such as Java Runtime Environment or the Oracle database product) and OS-registered software.
The Concurrent Processing configuration details can be accessed from the Administration tab.
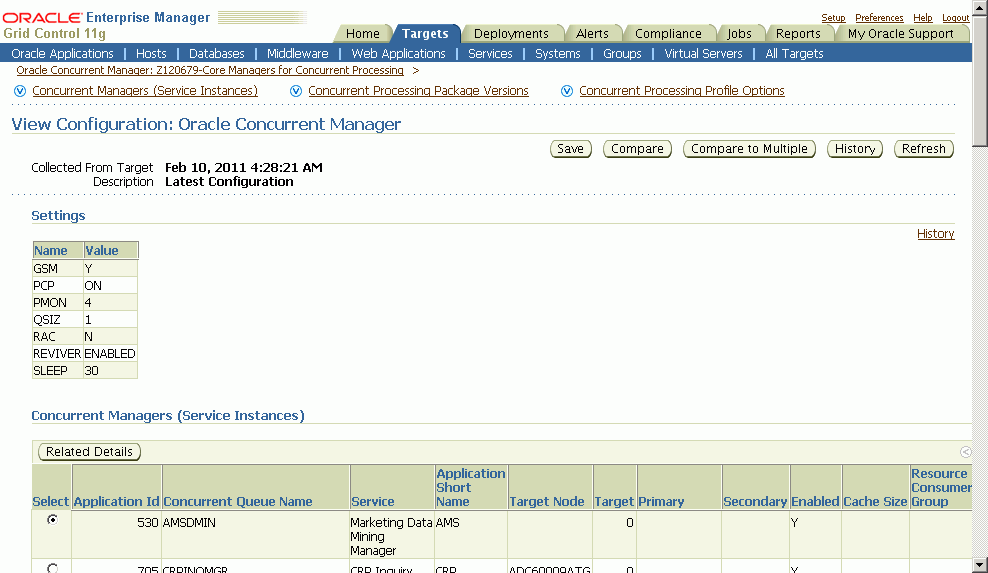
You can view the configuration information for the concurrent processing component of the Oracle E-Business Suite system. The configuration information that can be viewed is:
Profile option settings for concurrent processing
Concurrent managers and their configuration attributes
The configuration information for the Oracle Workflow component of the Oracle E-Business Suite system is available from the Administration tab.
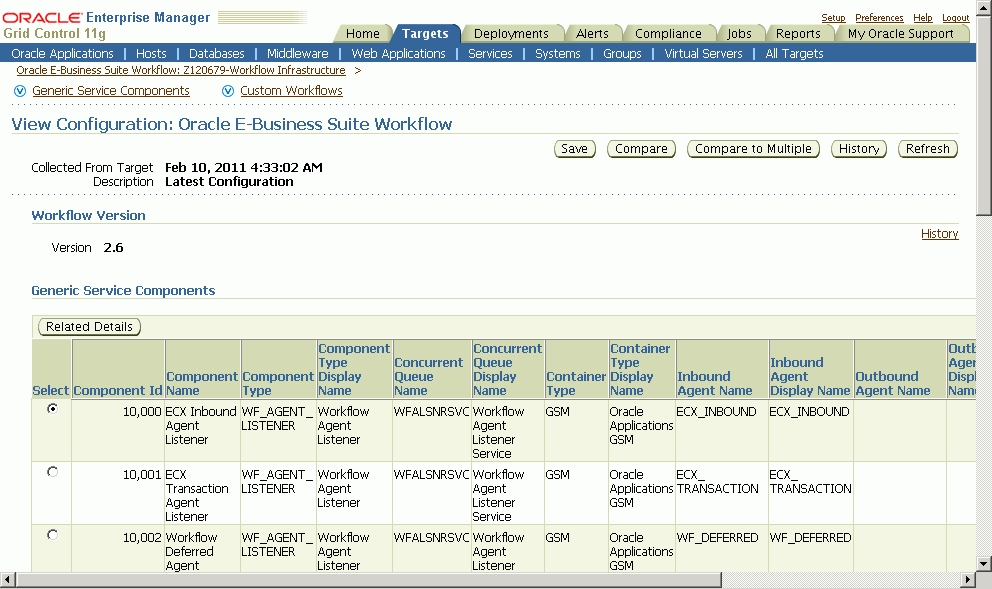
Configuration information is shown for the following components:
XML Gateway (ECX) Inbound Agent Listener
XML Gateway (ECX) Transaction Agent Listener
Workflow Deferred Agent Listener
Workflow Deferred Notification Agent Listener
Workflow Inbound Notifications Agent Listener
Workflow Notification Mailer
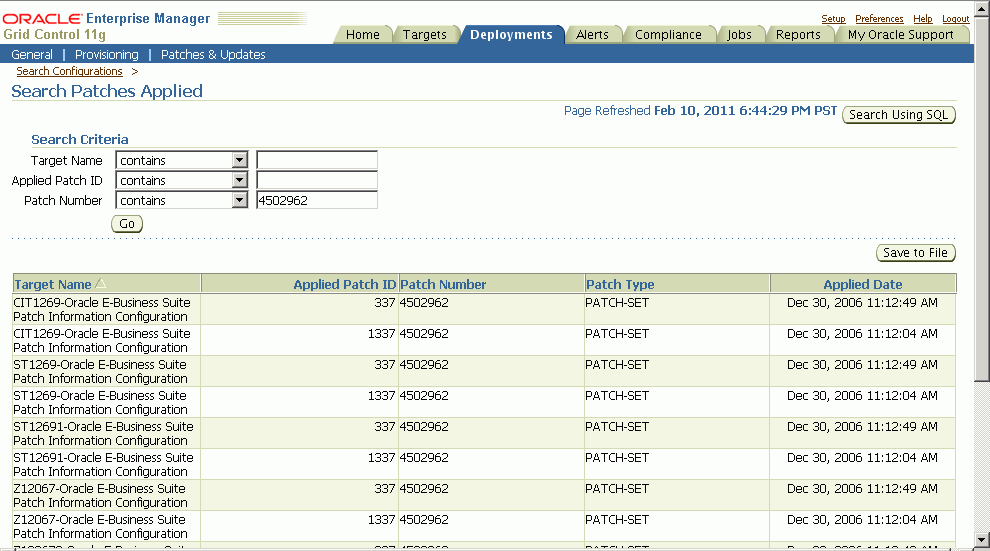
You can search for Oracle E-Business Suite patch/patchset information from the Administration tab.
You can search for patch information by Target Name, Applied Patch ID, or Patch Number.
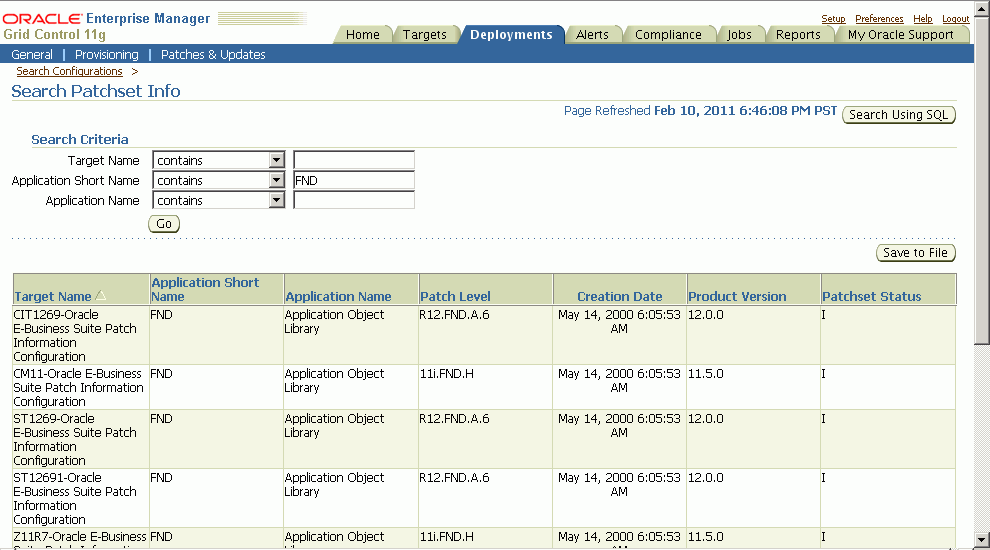
You can search for patchset information by Target Name, Application Short Name, or Application Name.
For all the configuration reports you have viewed in the earlier sections, you can perform a one-to-one comparison of the report with that of another instance or the same report that was saved previously.
Click the Compare button within the configuration report.
Choose the configuration report from another instance or from a "Saved Configurations" of the current system and click the Compare button.
The comparison results are shown.
You can also compare a configuration report to other reports for multiple instances in a single request.
To compare configuration with multiple other configurations, click the Compare to Multiple button within the configuration report.
By default the latest configuration information for the system is used for comparison. However, you can choose information from another saved configuration (with an earlier timestamp).
Select all the Oracle E-Business Suite systems whose configuration information needs to be compared with the first (selected in the earlier step). Any number of Oracle E-Business Suite systems can be added for comparison. By default, their latest configuration information is utilized; however, a saved "snapshot" can also be used.
You can schedule the comparison to begin immediately or on a future date (also an option to choose a convenient time zone is available). This comparison job can also be repeated and options for the same are available in this page.
Complete the comparison job by reviewing the details that you had provided.
View the result summary of the comparison job done across multiple instances.
Click the Different link to view the actual differences between configurations.
The Oracle Applications Maintenance page provides access to the Oracle Application maintenance activities particularly in the areas of patching and cloning.
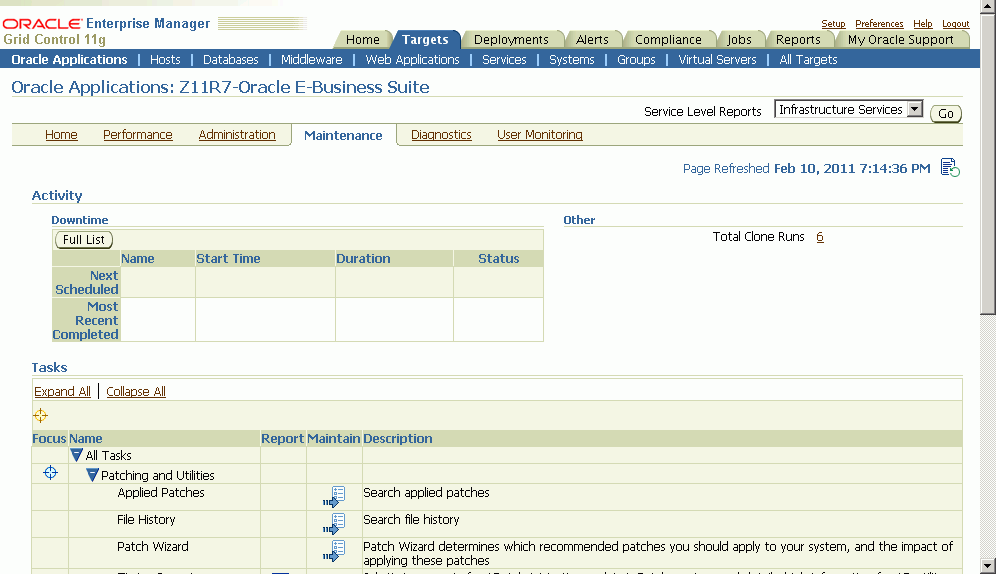
The Maintenance page is divided into the three sections:
Activity - This section provides a summary of system down time that has been scheduled and that have recently been completed.
Tasks - The Tasks table provides links to various patching and cloning tasks.
Patching tasks - these links direct you to the corresponding tasks page within Oracle Applications Manager.
Cloning tasks - Cloning can be done automatically from the Oracle Application Management Pack for Oracle E-Business Suite and is discussed later in this document.
Links for other maintenance activities are also provided.
The Diagnostics page provides summary results of Diagnostic Test execution within the system.
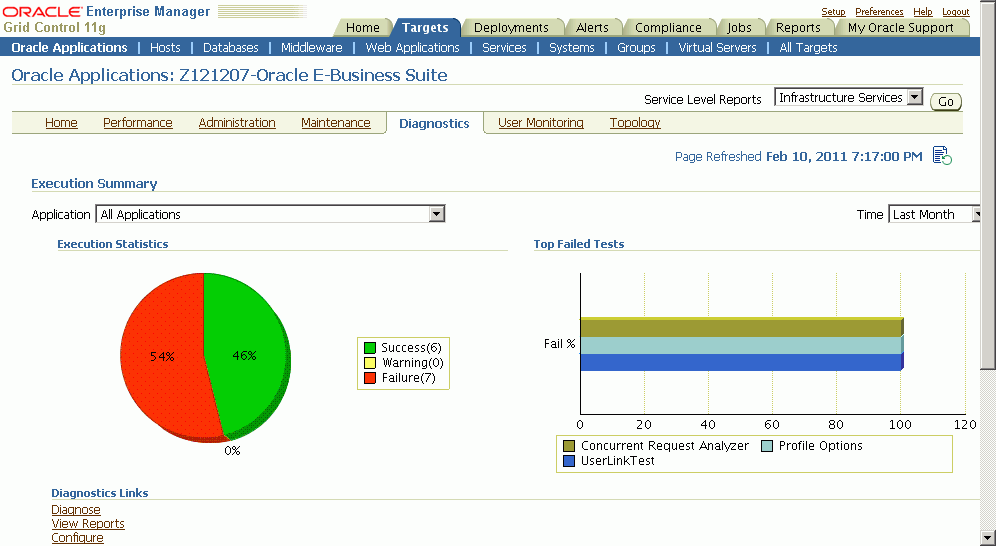
The Diagnostics Dashboard shows the execution statistics of diagnostic tests across all applications as well as for a specific application.
Navigation: From the Oracle E-Business Suite instance's Application Management Pack Dashboard, navigate to the Diagnostics subtab.
The dashboard has two charts, one pie chart and a bar chart. These charts allows you to select the application for which the statistics is needed. By default statistics across all applications is displayed.
It is a possible to see the statistics for last month, last week, or last 24 hours.
The Execution Statistics pie chart show the success, failure, and warning rates of diagnostics tests depending on the selection of application.
The Top Failed Tests bar chart shows the top five failed tests in terms of percentage of failure. By default tests across all applications is shown. You can see the top failed tests under a specific application by selecting it.
Links are provided to open the associated Oracle E-Business Suite instance in a separate window and open up the Oracle Diagnostics pages in Oracle E-Business Suite.
The User Monitoring page enables you to link a database session to an Oracle E-Business Suite user session. In this way you can link a performance issue in a database session to activity done by that Oracle E-Business Suite user. The User Monitoring feature checks three entities: Concurrent Programs requests, Forms sessions, and Oracle Application Framework sessions to see if it can find a match for the database session ID.
Note: If the database session is triggered by something else, this system will not be able to capture it. This is a limitation.
User Monitoring requires additional setup steps. On the OMS side:
Set the preferred credentials of "Oracle E-Business Suite" target type for the Applications login user name and password.
Additional setup steps required on the Oracle E-Business Suite side are:
For the above Applications login user, assign "LCM_EM_CLIENT" responsibility.
Form sessions can be monitored only when the following site-level profile is set to 'FORM': Profile Name - Sign-On:Audit Level, Profile Code - SIGNONAUDIT:LEVEL.
You can run diagnostic tests on your system for user monitoring. These tests can be accessed from the Diagnostics dashboard, available from the Pack Diagnostics link on the Oracle Applications page. For more information on running diagnostic tests, see: Running Pack Diagnostics Tests.
The following tables list tests for user monitoring.
| Task | Step | Description | Notes/Expected Results/Corrective Measures |
|---|---|---|---|
| EBS | CheckIOPatches for 11i Release | Verify that certain patches have been applied on the Oracle E-Business Suite target. | Note that this step may change, depending on the Oracle E-Business Suite release (for example, Release 11i, 12.0, and so on). The list of patches is contained in an XML file that might be modified to include or exclude recommended patches. |
| EBS | CheckRESTHealth | Checks if "Rest Ping" is working properly. Rest Ping is a Ping Service, called using REST framework. The Ping Service tries to ping Oracle E-Business Suite instance and this should return a “SUCCESS”. User monitoring is heavily dependent on this framework. | If the test fails, normally it gives the message why it failed. Refer to the emoms.log for additional information. |
| EBS | Summary | A summary of all of the diagnostic tests that have been executed, in the following groups: Successful, Failed, With Warning, Aborted, and Total. |
| Task | Step | Description | Notes/Expected Results/Corrective Measures |
|---|---|---|---|
| EMGC | None | None | |
| EBS | CheckEBSProfile | Check if the Oracle E-Business Suite profile is properly set. User Monitoring functionality displays a user's form related activities. To show this information, a user's system profile code “SIGNONAUDIT:LEVEL” must be set to FORM. This checks if the profile value is set to FORM. | Verify that the credentials supplied are valid for the "Applications Login" username/password, found in the in "E-Business Suite" Target Type in Preferred Credentials. Verify that the user specified in the "Applications Login" section has their "SIGNONAUDIT:LEVEL" profile set to "FORM". |
| EBS | CheckEBSRole | Verify if the EM User (that is, the user executing the diagnostic test) has the required responsibility to execute User Monitoring Functionality. The responsibility is LCM_EM_CLIENT, and must be attached to the Oracle E-Business Suite user in the “Oracle E-Business Suite” Applications Login Preferred Credentials. | Verify that the credentials supplied are valid for the "Applications Login" username/password, found in the in "E-Business Suite" Target Type in Preferred Credentials. Verify that the user specified in the "Applications Login" section has been assigned the "LCM_EM_CLIENT" responsibility. |
| EBS | CheckEBSGlobalCred | Check Oracle E-Business Suite preferred credentials This test verifies if the "Applications Login" username and password exists and, if so, are valid for a particular instance. | Verify that the credentials supplied are valid for the "Applications Login" username/password, found in the in "E-Business Suite" Target Type in Preferred Credentials. |
| EBS | Summary | A summary of all of the diagnostic tests that have been executed, in the following groups: Successful, Failed, With Warning, Aborted, and Total. |
Navigate to the User Monitoring dashboard from the Oracle E-Business Suite instance's User Monitoring subtab.
The dashboard has four bar charts of database sessions (triggered by APPS user only)
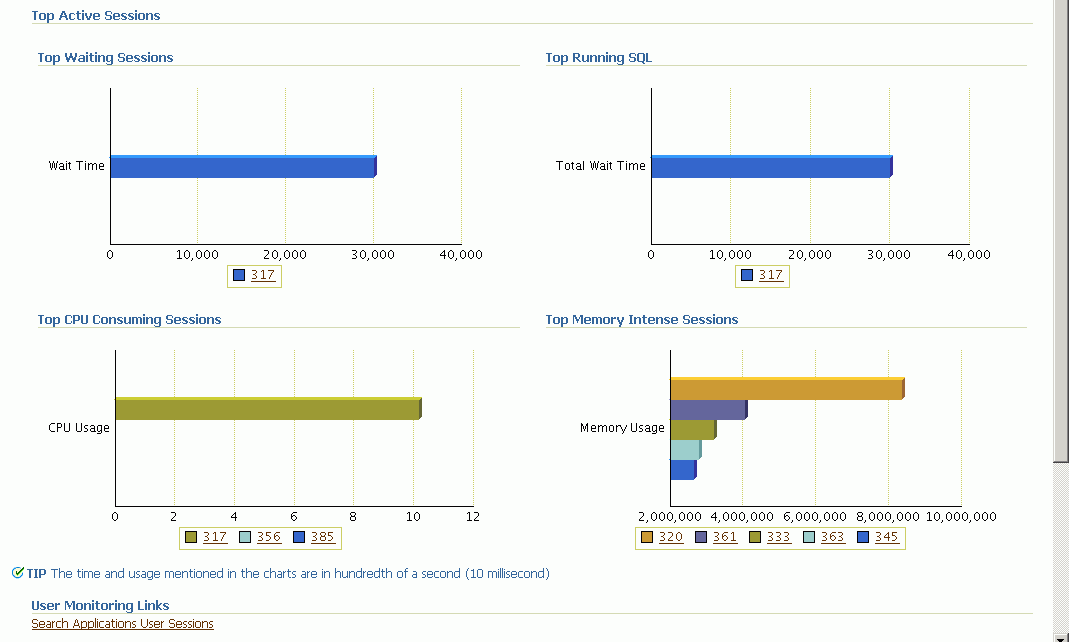
Top waiting sessions; that is, sessions waiting for a database event to trigger to proceed further
Top running SQL statements
Top CPU consuming sessions
Top memory intense sessions
The count in the bar chart is configurable by setting the property um_dashboard_no_of_rows in the "amp.properties" configuration file with the maximum limit as 10. The legend of the graph shows the name of the Oracle E-Business Suite user for the corresponding session in the graph. If Oracle E-Business Suite user is not available, the database SID itself is shown in the legend.
You can drill down from the legend to see the details of the session. If the Oracle E-Business Suite user information is available, the Oracle E-Business Suite session details will be shown with further drilldown to the database session details. If the Oracle E-Business Suite user information is not available, you can drill down to the database session details. The charts are derived by monitoring session history for the last 15 minutes. This interval is configurable by setting the property um_session_sampling_interval in the amp.properties file. The maximum value allowed is 60.
Note: If you make changes to the configuration file "amp.properties", the changes will take at least fifteen (15) minutes to take effect. If you want the changes to take effect immediately, restart the OMS.
You can search for Oracle E-Business Suite user sessions from the User Monitoring subtab.
The link to this search feature is available in the dashboard itself.
Using DB Session ID - Provide the database session ID and if a match is found with a concurrent program, form or OA page, the details will be shown with a drilldown facility to the database session details.
Using Oracle E-Business Suite user name - This search shows all the active concurrent programs, Forms, and Oracle Application Framework pages used by the user. It will also show the associated database session ID with drilldown capability.
Note: This page is available for Oracle E-Business Suite Release 12 only.
In addition, the topology view is available only with Internet Explorer 5.5 or later on Windows.
The Oracle Application System Topology page lists the dependencies between the infrastructure services, the key system components, and other services that define their availability. Upon service failure, the potential causes of failure, as identified by Root Cause Analysis, are highlighted in the topology view. In the Topology page, you can view dependent relationships between services and systems.
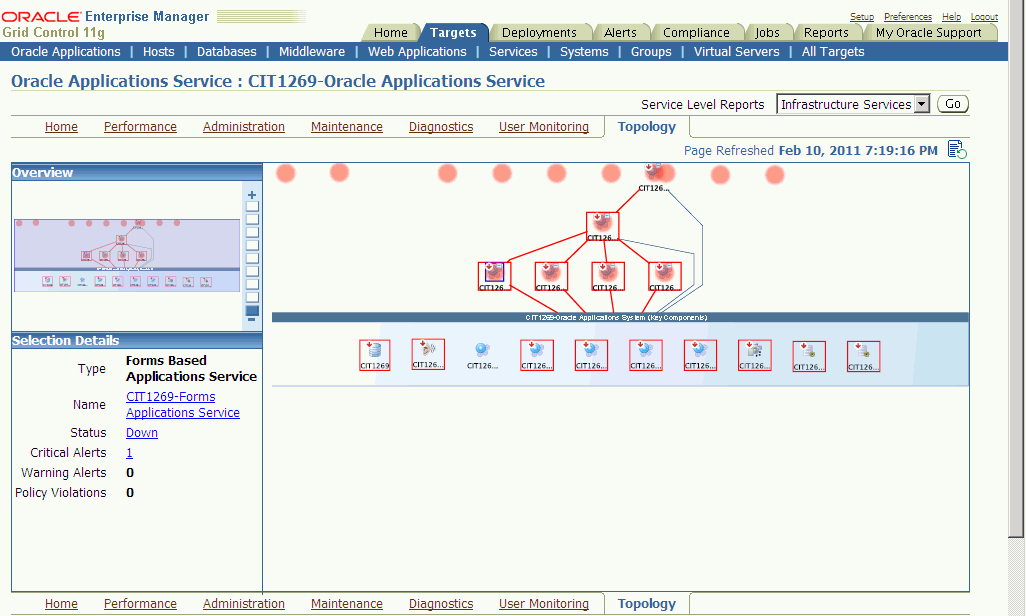
The Topology page shows the infrastructure service Topology view of the Oracle Application system. The icons represent each service and the lines connecting them show their dependencies. This view allows administrators to identify the root cause of a problem much more quickly compared to a tabular representation of the same information.
Links to related features are also on this page, including:
All Metrics
Metric Thresholds
Target Properties
Monitoring Configuration
Alerts History
Configured Components
Configure Order Management
![]()
Copyright © 2007, 2011, Oracle and/or its affiliates. All rights reserved.