11 Monitoring for High Availability
This chapter provides best practices for monitoring your system using Enterprise Manager and to monitor and maintain a highly available environment across all tiers of the application stack.
This chapter contains the following topics:
11.1 Overview of Monitoring and Detection for High Availability
Continuous monitoring of the host, network, database operations, application, and other system components ensures early detection of problems. Early detection improves the user's system experience because problems can be avoided or resolved faster. In addition, monitoring captures system metrics to indicate trends in system performance, growth, and recurring problems. This information can facilitate prevention, enforce security policies, and manage job processing. For the database server, a sound monitoring system must measure availability and detect events that can cause the database server to become unavailable, and provide immediate notification about critical failures to responsible parties.
The monitoring system itself must be highly available and adhere to the same operational best practices and availability practices as the resources it monitors. Failure of the monitoring system leaves all monitored systems unable to capture diagnostic data or alert the administrator about problems.
Enterprise Manager provides management and monitoring capabilities with many different notification options. Recommendations are available for methods of monitoring the environment's availability and performance, and for using the tools in response to changes in the environment.
11.2 Using Enterprise Manager for System Monitoring
A major benefit of Enterprise Manager is its ability to manage components across the entire application stack, from the host operating system to a user or packaged application. Enterprise Manager treats each of the layers in the application as a target. Targets—such as databases, application servers, and hardware—can then be viewed along with other targets of the same type, or can be grouped by application type. You can also review related targets in a single view from the High Availability Console (for more information, Section 11.3.3, "Manage Database Availability with the High Availability Console"). Each target type has a default generated home page that displays a summary of relevant details for a specific target. You can group different types of targets by function; that is, as resources that support the same application.
Every target is monitored by an Oracle Management Agent. Every Management Agent runs on a host and is responsible for a set of targets. The targets can be on a host that is different from the one that is used by the Management Agent. For example, a Management Agent can monitor a storage array that cannot host an agent natively. When a Management Agent is installed on a host, the host is automatically discovered along with other targets that are on the machine.
Moreover, to help you implement the Maximum Availability Architecture (MAA) best practices, Enterprise Manager provides the MAA Advisor (for more information, see Section 11.3.4, "Configure High Availability Solutions with MAA Advisor"). The MAA Advisor page recommends Oracle solutions for most outage types and describes the benefits of each solution.
In addition to monitoring infrastructure with Enterprise Manager in the Oracle HA environment, Oracle Auto Service Request (ASR) can be used to resolve problems faster by using auto-case generation for Oracle's servers, storage systems, components, and Engineered Systems when specific hardware faults occur. For more information, see "Oracle Auto Service Request" in My Oracle Support Note 1185493.1 at
https://support.oracle.com/rs?type=doc&id=1185493.1
See Also:
Enterprise Manager Cloud Control Introduction for information about Enterprise Manager Architecture and the Oracle Management Agent11.2.1 Oracle Enterprise Manager Home Page
Administrators can select the Enterprise Manager Home Page that provides the most relevant information based upon their role, choosing from a set of suggested pages such as the Enterprise Summary page shown in Figure 11-1 that shows the availability of all discovered targets. Administrators can also select any page in Enterprise Manager as their home page.
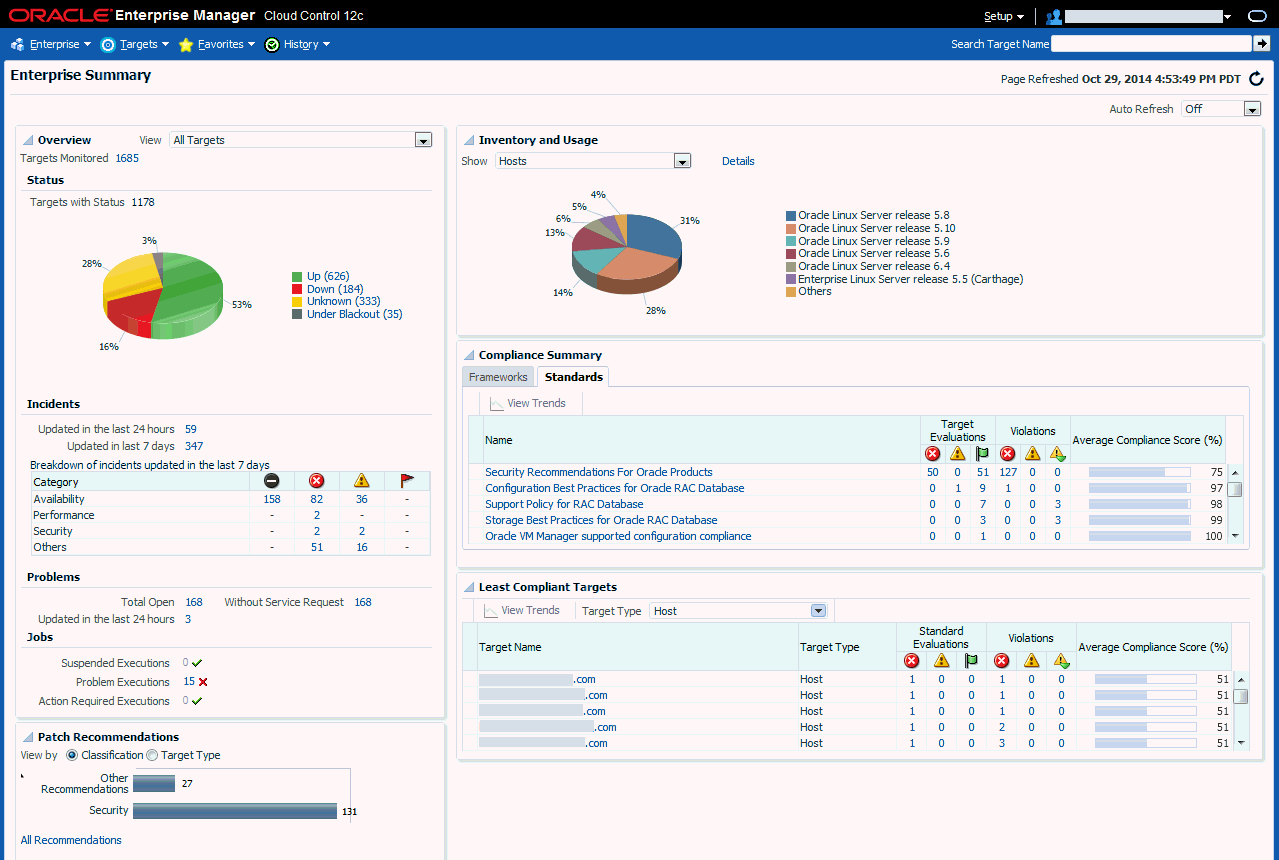
The Enterprise Summary page provides administrators with a consolidated view of rollup information across a variety of areas that can affect availability, from critical incidents and failed jobs to recommended patches and compliance violations, providing the ability to drill into relevant details for further analysis, to take action to react to critical issues, and to proactively maintain environments to ensure availability.The Enterprise Summary page includes the following information:
-
A snapshot of the current availability of all targets. The Status pie chart gives the administrator an immediate indication of how many targets are available (Up), unavailable (Down), or have lost communication with the console (Unknown), or have specifically had their monitoring suspended for reasons such as maintenance operations (Under Blackout). Click on any of the statuses to drill down into a list of the targets in that state, and drill further into individual targets to analyze and take corrective action.
-
An overview of how many incidents and problems are known in the entire monitored system. Drill down to view matching incidents in the Incident Manager by clicking the links. The administrator can access the Incident Manager directly from any Enterprise Manager page by selecting Enterprise > Monitoring > Incident Manager or by pressing Ctrl+Shift+I.
-
The number of suspended, problem (stopped/failed), and action required executions for all Enterprise Manager jobs. Click the number next to the status group to view a list of those jobs.
-
Patch recommendations, viewable by classification or target type. Drill down to view details in the Patches & Updates page for the selected set of patches or to view all recommendations.
-
A Compliance Summary displaying by compliance framework and compliance standard the results of compliance standard evaluations and the severity and total number of related violations for all managed targets. Drill down to view the Compliance Reports page and to determine the source and type of violation.
-
A view of the least compliant targets by selected target type, including the result of compliance standard evaluations and the severity and total number of related violations. Drill down to determine the source and type of violation.
The following sections provide best practices, configuration recommendations, and relevant links to additional information regarding these capabilities. Tailoring the monitoring to the business needs and details of your environment helps to ensure that the data displayed on this page helps your administrators effectively manage the availability of your environments.
Your ability to use these capabilities is dependent upon ensuring the availability of the Enterprise Manager system itself. See "EM Operational Considerations and Troubleshooting Whitepaper Master Index" in My Oracle Support Note (Doc ID 1940179.1 for best practices for configuring, operating, and diagnosing Enterprise Manager to ensure the availability of the Enterprise Manager system.
See Also:
"EM Operational Considerations and Troubleshooting Whitepaper Master Index" in My Oracle Support Note (Doc ID 1940179.111.2.2 Configure Metrics and Incident Rule Sets
Enterprise Manager takes a comprehensive approach to monitoring, management, and resolution of issues, organizing the process into three levels: event management, incident management, and problem management.
-
An event is something that happens on a managed target, often indicating something abnormal has occurred. Metric alerts, availability alerts, compliance violations, and job events are examples of events.
-
An incident is composed of one or more significant events that need to be managed together because of the potential impact of the event(s) to the business. Incident resolution is focused on mitigating the business impact. Incidents are created automatically or manually and are managed via the Incident Manager.
-
A problem is the root cause of an incident. Problem resolution is focused on resolving the root cause. Administrators use Support Workbench to open a Service Request (SR) for the problem with Oracle Support using the details from the Automatic Diagnostic Repository (ADR), and manage the problem via the Incident Manager.
Incident rule sets and incident rules provide the means to automate actions taken by Enterprise Manager with respect to events, incidents, and problems. There are two types of rule sets: enterprise rule sets and private rule sets. Enterprise rule sets provide a complete set of actions, while private rule sets can only send e-mail notifications to their owners. Enterprise rule sets are evaluated in order, may be evaluated in multiple passes, and are evaluated before private rule sets. The order is important as only one incident will be created for an event, so the first rule that matches the event will be the one that creates the incident. Each matching rule with a workflow or notification action will execute, so if there are multiple matching rules for an event, the last one that executes will determine the final value of the priority, assignment, etc., and administrators may receive multiple notifications for the same event. Rule sets and rules can be enabled and disabled.
Metric alerts and availability alerts are types of events generated by a combination of factors and are defined on specific metrics. A metric is a data point sampled by a Management Agent and sent to the Oracle Management Repository to determine the health of a target. An availability alert could be an evaluation of the availability of a component through a simple heartbeat test. A metric alert could be an evaluation of a specific performance measurement such as "disk busy" or percentage of processes waiting for a specific wait event.
There are four states that can be checked for any metric: error, warning, critical, and clear. The administrator must make policy decisions such as:
-
What objects should be monitored (databases, nodes, listeners, or other services)?
-
What instrumentation should be sampled (such as availability, CPU percent busy)?
-
How frequently should the metric be sampled?
-
What should be done when the metric exceeds a predefined threshold?
All of these decisions are predicated on the business needs of the system. For example, all components might be monitored for availability, but some systems might be monitored only during business hours. Systems with specific performance problems can have additional performance tracing enabled to debug a problem.
Incident Rules can take action on events such as metric alerts and can be defined to operate on all targets, targets of a specific type, targets in a specific group, or individual targets. For example, an administrator can create an incident rule that monitors the availability of database targets and generates an e-mail message if a database fails. After that incident rule is enabled, it is evaluated for all existing databases and any database created in the future. Access these rules by navigating to Setup, selecting Incidents, and then choosing Incident Rules.
The rules monitor issues that require immediate attention, such as those that can affect service availability, and Oracle or application errors. Service availability can be affected by an outage in any layer of the application stack: node, database, listener, and critical application data. A service availability failure, such as the inability to connect to the database, or the inability to access data critical to the functionality of the application, must be identified, reported, and reacted to quickly. Potential service outages such as a full archive log directory also must be addressed correctly to avoid a system outage.
Enterprise Manager provides a default incident rule set that provides a strong starting framework for monitoring availability. While you cannot modify Oracle's default incident rule sets, you can create your own copy of the out of box incident rule set and modify the rules to conform to the policies of each individual site. You can also create incident rule sets consisting of incident rules for site-specific targets or applications. Additionally, you can configure notification schedules to notify users during specific time periods to create an automated coverage policy.
Implement a strategy for managing incident rules using four logical categories:
-
High Availability
Create enterprise rule set(s) as applicable that focus on the availability of mission critical systems. Notify administrators when warning and critical thresholds are exceeded on the metrics that you identify. Locate the rule set(s) above the Oracle out of box rule sets so that any incident creation that you specify in the rule set(s) takes precedence.
-
Key Performance Indicators
Create enterprise rule set(s) as applicable that focus on the key performance indicators that are representative of the performance and throughput of the overall system. Notify administrators when warning and critical thresholds are exceeded on the metrics that you identify. Monitor to ensure required service level is achieved. Locate the rule set(s) above the Oracle out of box rule sets and below the High Availability rule set(s) so that any incident creation that you specify in the rule set(s) will occur if not created by High Availability rule set(s) and will take precedence over the out of box rule sets.
-
ADR Incidents
Make use of the ADR Incidents that are automatically generated by Oracle out of box. Incorporate notifications for these incidents into the rule sets in above categories as appropriate to notify administrators of relevant incidents and operational errors. Enable DB Alert Log metrics if/as necessary to address any additional required error monitoring.
-
Administrator's Choice
Each administrator creates private rule set(s) managed by the individual administrator, deciding on what is of most interest to them. Focus on providing more details and insight to ensure successful administration and operations, addressing deeper investigation, longer term, or lower priority concerns that would not warrant waking an administrator in the middle of the night. These rules may change more frequently.
Consider the following example. The Fast Recovery Area (FRA) is filling up on a database that is part of a mission critical system. Having sufficient space for the FRA is critical to availability. The database is associated with a group of targets that are associated with a high availability rule set. The rule set includes a rule that evaluates events of type Metric Alert for the Recovery Area Free Space (%) metric and sends e-mail notifications to administrators. The rule is configured to evaluate whether the severity is warning or critical, and sends an appropriate notification via the appropriate mechanism. When Enterprise Manager detects that the FRA crosses the warning threshold, Enterprise Manager raises an event of type Metric Alert. The rules in the high availability rule set are evaluated. When Enterprise Manager processes the rule for the FRA, it determines that the severity of the Metric Alert event is warning, and sends an email to the administrators on their standard email accounts because an action has been specified to send an email to notify administrators via their standard email address when the FRA crosses the warning threshold. Had the FRA crossed the critical threshold, a rule action would have sent an email to the administrators' pager addresses. Unlike most metrics, the Recovery Area Free Space (%) warning and critical thresholds cannot be edited. You can create a Metric Extension if different thresholds are required.
Use the following best practices:
-
When creating enterprise rule sets, place those above the out of the box Oracle incident rule set so that your custom rule sets fire first.
-
Use monitoring templates to configure metrics for each target type. This allows standardization of metrics for similar targets in environments. You may have different templates for the same target types in different environments (such as development and production) and within different applications or hardware configurations (such as where thresholds would be different due to storage space or processing differences).
-
Use administration groups and template collections to ensure that monitoring templates are automatically applied to targets added to the administration groups. This removes the need to manually apply the monitoring templates to the targets.
-
Ensure that metric thresholds are set appropriately for each target type in each environment to suit your availability requirements. Consider setting thresholds for the metrics in Table 11-1, Table 11-2, Table 11-4, and Table 11-5. The frequency of the monitoring is determined by the service-level agreement (SLA) for each component.
-
Create incident rules that notify administrators appropriately for each environment based on the key metric alert and target availability events.
-
Use Beacon functionality to track the performance of individual applications. A Beacon can be set to perform a user transaction representative of normal application work. Enterprise Manager can then break down the response time of that transaction into its component pieces for analysis. In addition, an alert can be triggered if the execution time of that transaction exceeds a predefined limit.
-
Configure multiple e-mail addresses for administrators who have pagers, cell phones, or mobile devices that can receive messages via e-mail. Use the Email Type of Pager with the email addresses for these devices and the Email Type of Email for standard email addresses. Within Incident Rules, differentiate between critical and warning messages, adding administrators to the Page field to send notifications for critical alerts to email addresses associated with these devices to ensure critical notifications are received as quickly as possible, and adding administrators to the Email To field to send notification for warning events to the regular e-mail address.
-
Add Notification Methods and use them in each Incident Rule when notifications are sent. By default, the easiest method for alerting an administrator to a potential problem is to send e-mail as discussed previously. Supplement this notification method by adding a callout to an SNMP trap or operating system script that sends an alert by some method other than e-mail. This avoids problems that might occur if a component of the e-mail system fails. Set additional Notification Methods by using the Setup link at the top of any Enterprise Manager page and selecting Notification Methods for scripts and SNMPv1 Traps, or selecting SNMPv3 Traps.
-
Create or modify Incident Rules to notify the administrator when there are errors in computing target availability. Select "Metric error detected" in the Availability States for a Target Type on the Select Target Availability Events form when editing or creating a rule of type Target Availability. This might generate a false positive reading on the availability of the component, but it ensures the highest level of notification to system administrators. See Figure 11-2 Setting Incident Rules for Availability for an example of the Select Target Availability events form where this option is available to be selected.
See Also:
-
Oracle Enterprise Manager Cloud Control Administrator's Guide for information about Monitoring and using Metrics
-
Oracle Enterprise Manager Cloud Control Administrator's Guide for information about Incident Management including Events, Incidents, Problems, Rule Sets, and Rules
-
For more information about Rule Sets and Incident Rules in Enterprise Manager 12c, see "12c Cloud Control: What are Incident Management Rule Sets and Incident Rules?" in My Oracle Support Note (Doc ID) 1556225.1 at
https://support.oracle.com/CSP/main/article?cmd=show&type=NOT&id=1556225.1 -
Oracle Enterprise Manager Cloud Control Administrator's Guide for information about Notifications
-
Oracle Enterprise Manager Cloud Control Administrator's Guide for information about Administration Groups
-
Oracle Enterprise Manager Cloud Control Administrator's Guide for information about Monitoring Templates
-
Oracle Enterprise Manager Cloud Control Administrator's Guide for information about configuring Service Tests and Beacons
Figure 11-2 shows the Select Target Availability events page for choosing availability states for a Cluster Database, with the Down option chosen.
Figure 11-2 Setting Incident Rules for Availability
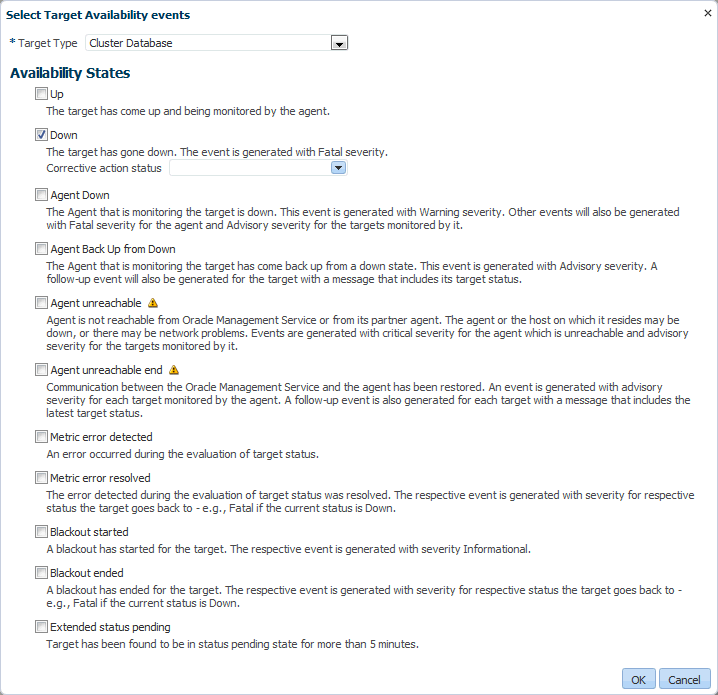
Description of "Figure 11-2 Setting Incident Rules for Availability"
Use the metrics shown in Table 11-1 to monitor space management conditions that have the potential to cause a service outage.
Table 11-1 Recommendations for Monitoring Space
| Metric | Recommendation |
|---|---|
|
Tablespace Space Used (%) |
Set this database-level metric to check the Available Space Used (%) for each tablespace. For cluster databases, this metric is monitored at the cluster database target level and not by member instances. This metric enables the administrator to choose the threshold percentages that Enterprise Manager tests against, and the number of samples that must occur in error before a message is generated and sent to the administrator. If the percentage of used space is greater than the values specified in the threshold arguments, then a warning or critical alert is generated. The recommended default settings are 85% for a warning and 97% for a critical space usage threshold, but you should adjust these values appropriately, depending on system usage. Also, you can customize this metric to monitor specific tablespaces. Note: there is an Enterprise Manager Job in the Job Library named:
Use this Job to disable alerts for all Beginning with Database Plugin 12.1.0.6, monitoring of TEMP and UNDO tablespaces has been separated into two new metrics: Tablespace Space Used (%) (Temp) and Tablespace Space Used (%) (Undo). For more information, see Testing and Troubleshooting the 'Tablespace Space Full (%)' metric in Enterprise Manager 12.1.0.4 in My Oracle Support Note (Doc ID) 1927636.1 at https://support.oracle.com/CSP/main/article?cmd=show&type=NOT&id=1927636.1. |
|
Dump Area Used (%) |
Set this metric to monitor the dump directory destinations. Dump space must be available so that the maximum amount of diagnostic information is saved the first time an error occurs. The recommended settings are 70% for a warning and 90% for a critical threshold error, but these should be adjusted depending on system usage. Set this metric in the Dump Area metric group. |
|
Recovery Area Free Space (%) |
This is a database-level metric that is evaluated by the server every 15 minutes or during a file creation, whichever occurs first. The metric is also printed in the alert log. For cluster databases, this metric is monitored at the cluster database target level and not by member instances. The Critical Threshold is set for < 3% and the Warning Threshold is set for < 15%. You cannot customize these thresholds. An alert is returned the first time the alert occurs, and the alert is not cleared until the available space rises above 15%. |
|
File system Space Available(%) |
By default, this metric monitors file systems on the host using the default warning threshold of 20% and the critical threshold of 5%. Thresholds can be set separately by file system. |
|
Archive Area Used (%) |
Set this metric to return the percentage of space used on the archive area destinations. Thresholds can be set separately for each Archive Area Destination. If the space used is more than the threshold value given in the threshold arguments, then a warning or critical alert is generated. If monitoring a cluster database that does not use a shared archive area, disable this metric at the cluster database level and enable this metric at the database instance level. If the database is not running in If the database is configured to archive to the Fast Recovery Area, this metric is not applicable. Instead, use the Recovery Area Free Space (%) metric to monitor the Fast Recovery Area. |
In Enterprise Manager 12c the mechanism for monitoring the Database Alert Log is tightly integrated with the Support Workbench, with the benefits of being able to generate packages for each problem or incident reported and quickly upload them to support.
As part of integrating with the Support Workbench, errors are categorized into different classes and groups, each served by a separate metric. At the highest level of categorization there are two different classes of errors: incidents and operational errors.
-
Incidents are errors that are recorded in the database alert log file, which signify that the database being monitored has detected a critical error condition. For example a critical error condition could be a generic internal error or an access violation.
-
Operational Errors are errors that are recorded in the database alert log file, which signify that the database being monitored has detected an error that may affect the operation of the database. For example, an operational error could be an indication that the archiver is hung or a media failure.
Enterprise Manager automatically creates critical events for these incidents and operational errors. If these events are insufficient for your monitoring needs, you can supplement these by using one of two categories of metrics to configure warning and critical thresholds for a set of additional metrics that use the old pre-11g approach which monitors the text alert log. To do this, enable the disabled DB Alert Log metrics group metrics beginning with Database Plugin 12.1.0.4, or the disabled Alert Log metrics group metrics with earlier releases.
When using the DB Alert Log or Alert Log metrics, administrators can maintain the Alert Log Filter Expression in order to prevent certain errors that the administrator determines should be ignored from raising Metric Alert events in Enterprise Manager. To do this, edit the Alert Log Filter Expression, which is accessible by navigating to the Database target menu->Monitoring->Metrics and Collection Settings, and then selecting the edit icon to the right of Generic Alert Log Error under either DB Alert Log or Alert Log, depending upon which approach is being used.
Note:
For more information about Alert Log Monitoring in Enterprise Manager 12c, see "Database Alert log monitoring in 12c explained" in My Oracle Support Note 1538482.1 athttps://support.oracle.com/CSP/main/article?cmd=show&type=NOT&id=1538482.1
For details about the changes to alert log monitoring in Database Plugin 12.1.0.4, see " Changes to Alert Log Monitoring in Database Plugin 12.1.0.4" in My Oracle Support Note (Doc ID) 1587020.1 at
https://support.oracle.com/CSP/main/article?cmd=show&type=NOT&id=1587020.1
Monitor the system to ensure that the processing capacity is not exceeded. The warning and critical thresholds for these metrics should be modified based on the usage pattern of the system, following the recommendations in Table 11-2.
Table 11-2 Recommendations for Monitoring Processing Capacity
| Metric | Recommendation |
|---|---|
|
Process Limit Usage (%) |
Set thresholds for this metric to warn if the number of current processes approaches the value of the |
|
Session Limit Usage (%) |
Set thresholds for this metric to warn if the instance is approaching the maximum number of concurrent connections allowed by the database. |
Figure 11-3 shows the Metric and Collection Settings page for setting and editing metrics. The documentation library contains complete reference information for every metric. To access reference information for a specific metric, use the documentation library search feature.
Figure 11-3 Metric and Collection Settings Page
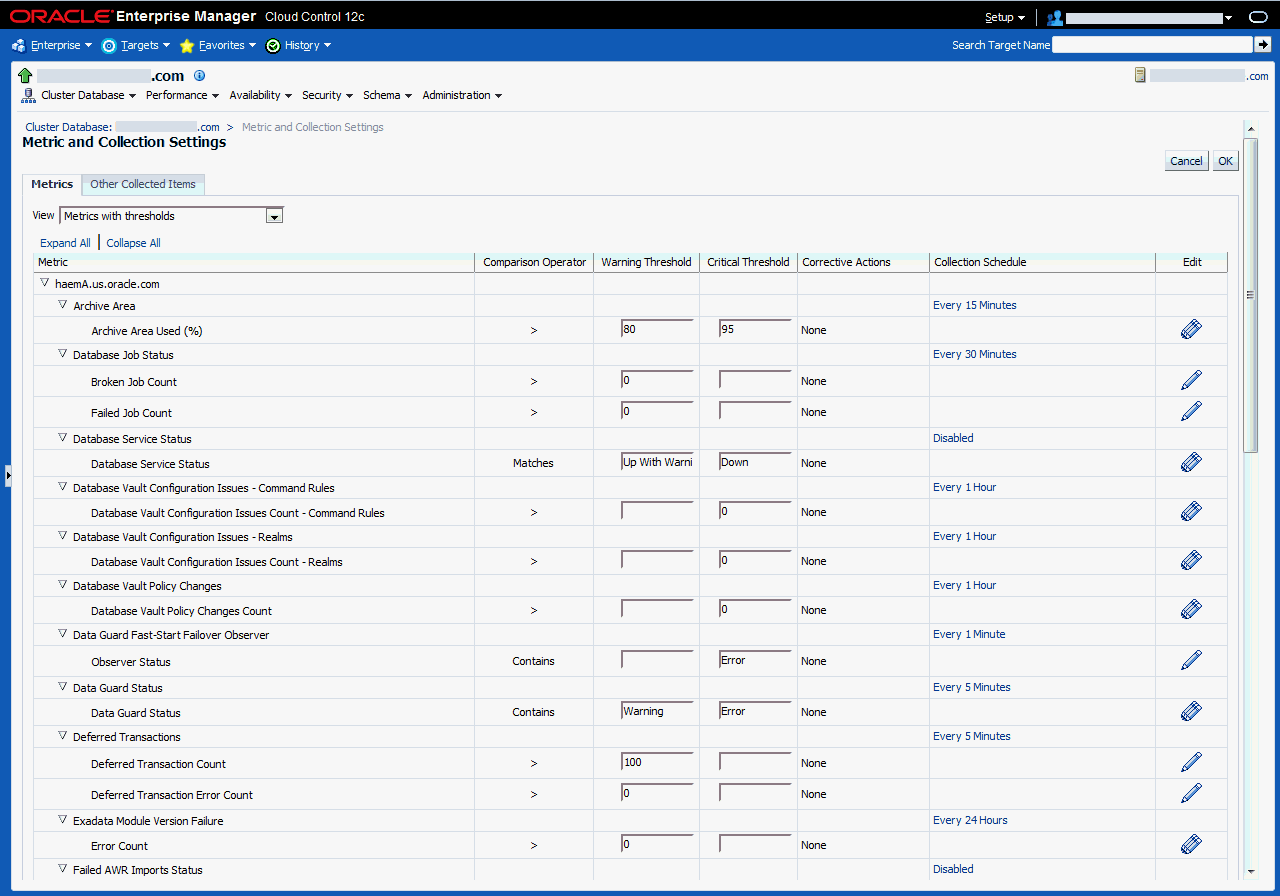
Description of "Figure 11-3 Metric and Collection Settings Page"
See Also:
-
Oracle Database 2 Day + Performance Tuning Guide for information about setting metric thresholds
-
Oracle Database Administrator's Guide for information on Viewing Problems with the Support Workbench
-
Oracle Enterprise Manager Oracle Database Plug-in Metric Reference Manual for information about available metrics
11.2.3 Use Database Target Views to Monitor Health, Availability, and Performance
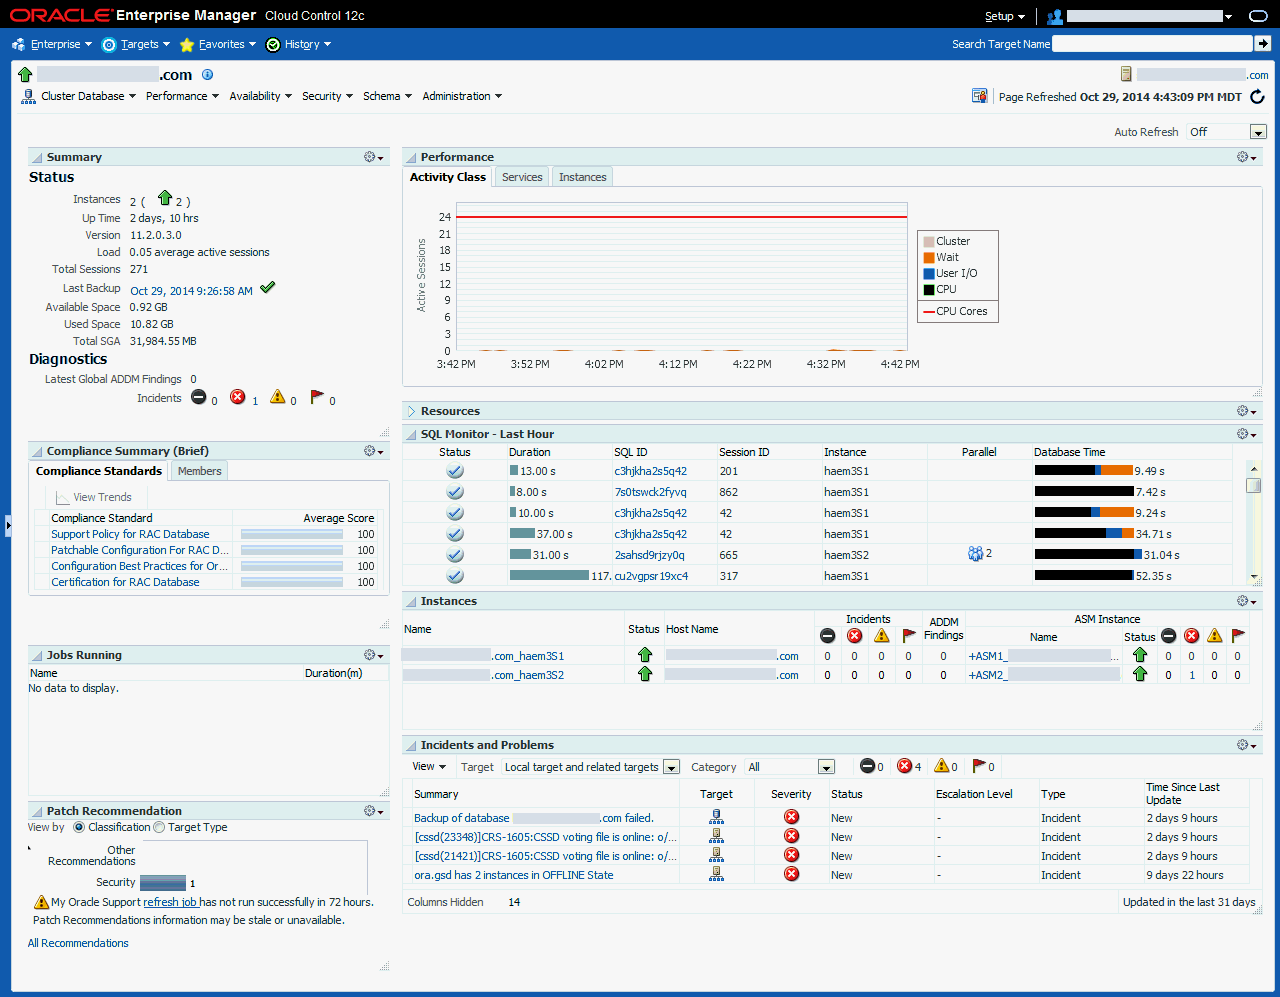
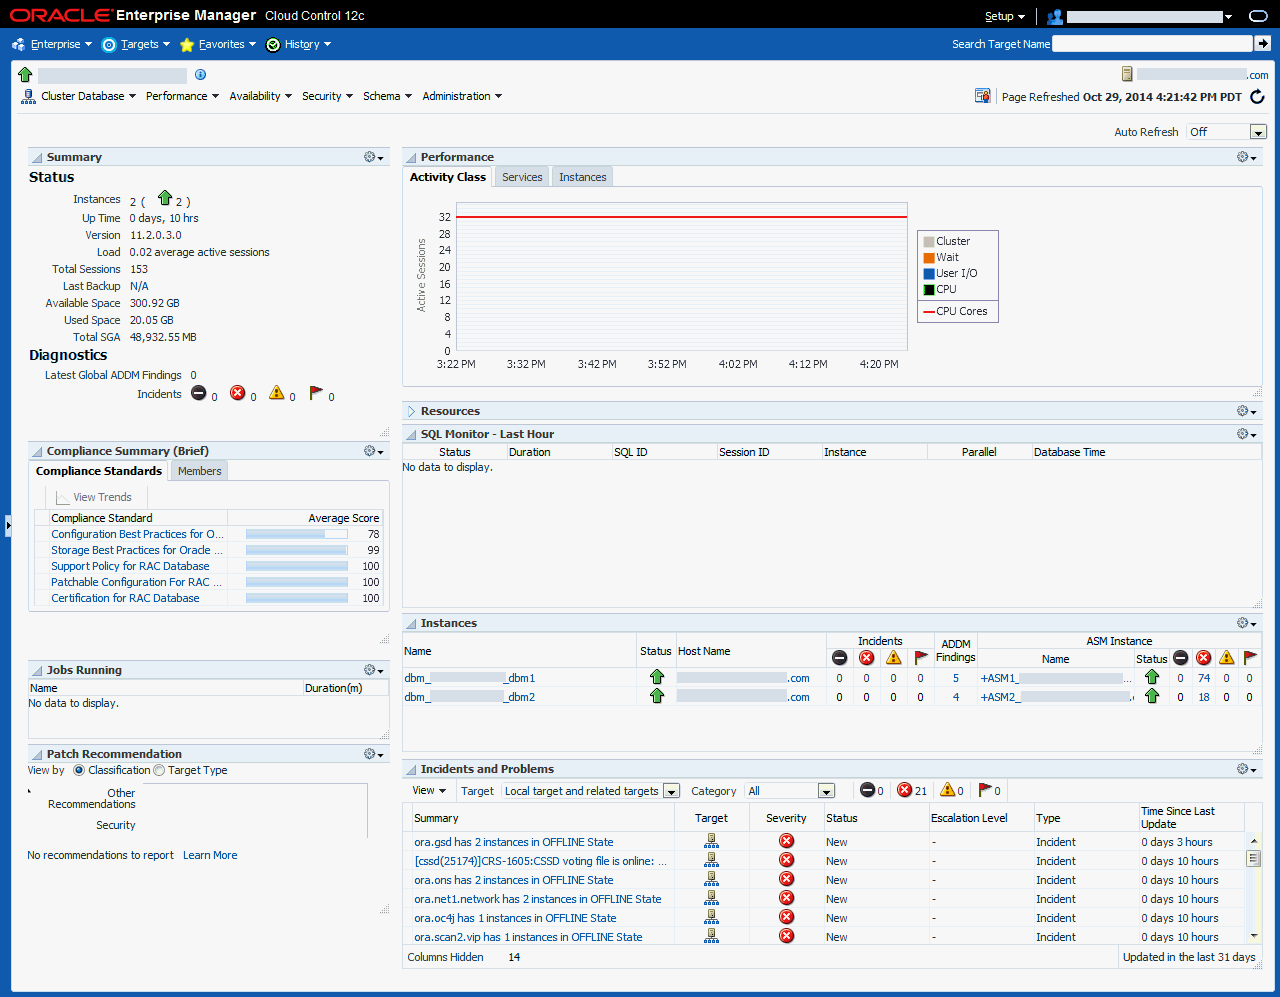
The Database target Home page in Figure 11-4 shows system performance, space usage, and information important to availability such as the date, time, and status of the last backup with a link to a backup report.
You can see the most recent incidents and problems for the target under the Incidents and Problems table, as shown in Figure 11-4. You can access further information about Incidents and Problems by clicking the links in the Summary column.
Performance Analysis and Performance Baseline
Many of the metrics for Database targets in Enterprise Manager pertain to performance. A system that is not meeting performance service-level agreements is not meeting High Availability system requirements. While performance problems seldom cause a major system outage, they can still cause an outage to a subset of customers. Outages of this type are commonly referred to as application service brownouts. The primary cause of brownouts is the intermittent or partial failure of one or more infrastructure components. IT managers must be aware of how the infrastructure components are performing (their response time, latency, and availability), and how they are affecting the quality of application service delivered to the end user.
A performance baseline, derived from normal operations that meet the service-level agreement should determine what constitutes a performance metric alert. Baseline data should be collected from the first day that an application is in production and should include the following:
-
Application statistics (transaction volumes, response time, web service times)
-
Database statistics (transaction rate, redo rate, hit ratios, top 5 wait events, top 5 SQL transactions)
-
Operating system statistics (CPU, memory, I/O, network)
You can use Enterprise Manager to capture a baseline snapshot of database performance and create an Automatic Workload Repository (AWR) baseline. Oracle recommends increasing the AWR retention period if practical in your environment; 30 days is a good starting point. Enterprise Manager compares these values against system performance and displays the result on the database Target page. Enterprise Manager can also send alerts if the values deviate too far from the established baseline. See "Use Automatic Performance Tuning Features" for more information about Automatic Workload Repository.
There is no formula that can be used to set specific thresholds for a given customer system. Thresholds should be determined using values that are some percentage above the normal operating value of the metric, accounting for the variability of the value. Depending upon the variability, one starting point could be to take the baseline value, multiply by 1.15 to set the warning threshold and multiply by 1.25 to set the critical threshold. As each system and value is different, the key is to understand the system and the performance data associated with a baseline during normal operations, set candidate values, and then monitor and adjust as necessary. System baselines and thresholds need to be reevaluated periodically as the behavior of the system can change over time for a variety of reasons including changes in usage patterns, system volume, and hardware and software updates.
Set thresholds as appropriate for the metrics listed in Table 11-3 for all database targets and incorporate into incident rules to provide notifications as needed.
Table 11-3 Recommendations for Performance Related Metrics
| Metric | Level | Recommendation |
|---|---|---|
|
I/O Requests (per second) |
Instance |
This metric represents the total rate of I/O read and write requests for the database. It sends an alert when the number of operations exceeds a user-defined threshold. Use this metric with operating system-level metrics that are also available with Enterprise Manager. Set this metric based on the total I/O throughput available to the system, the number of I/O channels available, network bandwidth (in a SAN environment), the effects of the disk cache if you are using a storage array device, and the maximum I/O rate and number of spindles available to the database. |
|
Database CPU Time (%) |
Instance |
This metric represents the percentage of database call time that is spent on the CPU. It can be used to detect a change in the operation of a system, for example, a drop in Database CPU time from 50% to 25%. The |
|
Wait Time (%) |
Instance |
Excessive idle time indicates that a bottleneck for one or more resources is occurring. Set this instance-level metric based on the system wait time when the application is performing as expected. |
|
Network Bytes (per second) |
Instance |
This metric reports network traffic that Oracle generates. This metric can indicate a potential network bottleneck. Set this metric based on actual usage during peak periods. |
|
Pages Paged-in (per second) |
Host |
For UNIX-based systems, represents the number of pages paged in (read from disk to resolve fault memory references) per second. This metric checks the number of pages paged in for the CPU(s) specified by the Host CPU(s) parameter, such as For Microsoft Windows, this metric is the rate at which pages are read from disk to resolve hard page faults. Hard page faults occur when a process refers to a page in virtual memory that is not in its working set or elsewhere in physical memory, and must be retrieved from disk. When a page is faulted, the system tries to read multiple contiguous pages into memory to maximize the benefit of the read operation. |
|
Run Queue Length |
Host |
For UNIX-based systems, the Run Queue Length metrics represent the average number of processes in memory and subject to be run in the last interval (1 minute average, 5 minute average, and 15 minute average). It is recommended to alert when Run Queue Length = # of CPUs. (An alternative way to do this is to monitor the Load Average metric and compare it to Maximum CPU.) This metric is not available on Microsoft Windows. |
See Also:
-
Oracle Database Performance Tuning Guide for more information about performance monitoring
-
Oracle Database 2 Day DBA for more information about monitoring and tuning using Enterprise Manager
-
Oracle Database 2 Day + Performance Tuning Guide for more information about monitoring and tuning using Enterprise Manager
11.2.4 Use Metrics to Monitor Data Guard System Availability
Set thresholds for Enterprise Manager metrics to monitor the availability of Data Guard configurations and incorporate into incident rules to provide notifications. As discussed regarding performance related metrics in the previous section, set the thresholds where applicable using values that are some percentage above normal operating values after monitoring the system and understanding what is normal in your environment. Consider your business Recovery Time Objective (RTO), Recovery Point Objective (RPO), and requirements of your Service Level Agreement(s) (SLA) as part of the thresholds. Reevaluate the thresholds over time to ensure they remain appropriate. Table 11-4 shows metrics that are available for monitoring Data Guard databases.
Table 11-4 Recommendations for Setting Data Guard Metrics
| Metric | Recommendation |
|---|---|
|
Notifies you about system problems in a Data Guard configuration. |
|
|
Displays (in seconds) how far the standby is behind the primary database. This metric generates an alert on the standby database if it falls behind more than the user-specified threshold (if any). Set warning and critical thresholds based upon RTO and SLA considerations. |
|
|
Displays the approximate number of seconds required to failover to this standby database. Set warning and critical thresholds based upon RTO and SLA considerations. |
|
|
Displays the Redo Apply rate in KB/second on this standby database. Set warning and critical thresholds to identify deviation from normal operations. |
|
|
Displays the approximate number of seconds of redo that is not yet available on this standby database. The lag may be because the redo data has not yet been transported or there may be a gap. This metric generates an alert on the standby database if it falls behind more than the user-specified threshold (if any). Set warning and critical thresholds based upon RPO considerations. |
11.3 Managing the High Availability Environment with Enterprise Manager
Use Enterprise Manager as a proactive part of administering any system and for problem notification and analysis, with the following recommendations:
-
Use Enterprise Manager to Manage Oracle Patches and Maintain System Baselines
-
Manage Database Availability with the High Availability Console
11.3.1 Check Enterprise Manager Compliance Results
Enterprise Manager includes a compliance management framework that provides automatic tracking and reporting on how well managed targets conform to standards. These standards can include industry, Oracle, and internal standards. Enterprise Manager comes with a pre-installed set of compliance standards for Oracle hardware and software including Database, Exadata Database Machine, Fusion Middleware, and more. These standards include recommendations of best practices for all databases. User-defined compliance frameworks and compliance standards can be created, either by creating like an existing framework or standard or by creating a brand new framework or standard.
To enable standards, navigate to the Compliance Library and associate the desired standards with the appropriate targets. In order to make use of some standards, such as security standards, templates must be applied to the targets first in order to collect the required information. For more details on which Oracle database compliance standards require which Oracle provided monitoring templates, see Oracle Enterprise Manager Cloud Control Oracle Database Compliance Standards. Compliance results are displayed on the targets' home pages in the Compliance Summary area, as shown in Figure 11-5.
Figure 11-5 Database Home Page with Compliance Summary
Description of "Figure 11-5 Database Home Page with Compliance Summary"
To see more details on Compliance Standard results, select a link in the Compliance Summary area. Figure 11-6 shows the Compliance Results page for the target and the selected Compliance Standard.
Figure 11-6 Database Target Compliance Results Page
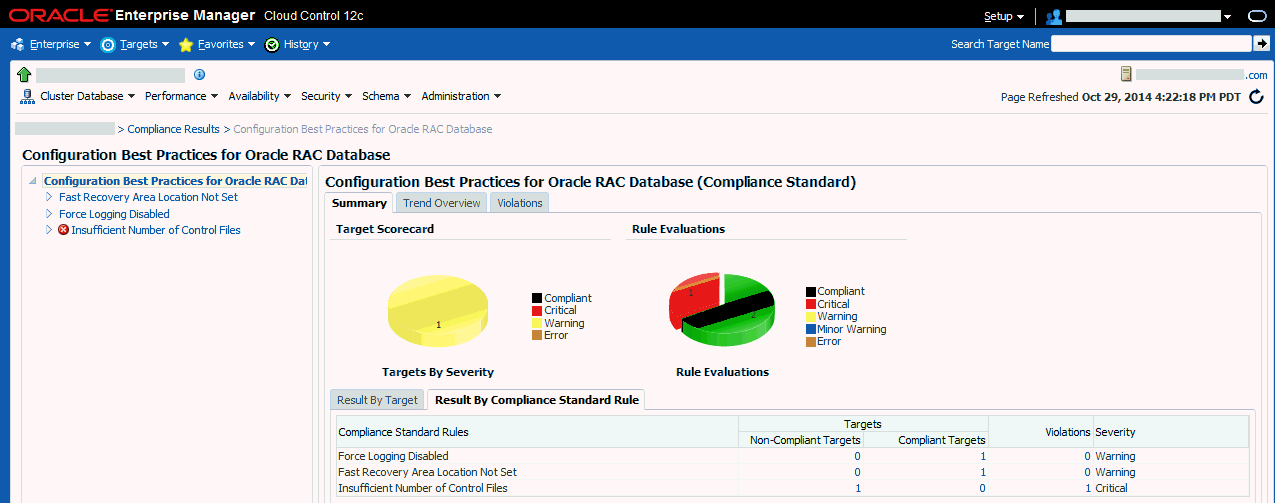
Description of "Figure 11-6 Database Target Compliance Results Page"
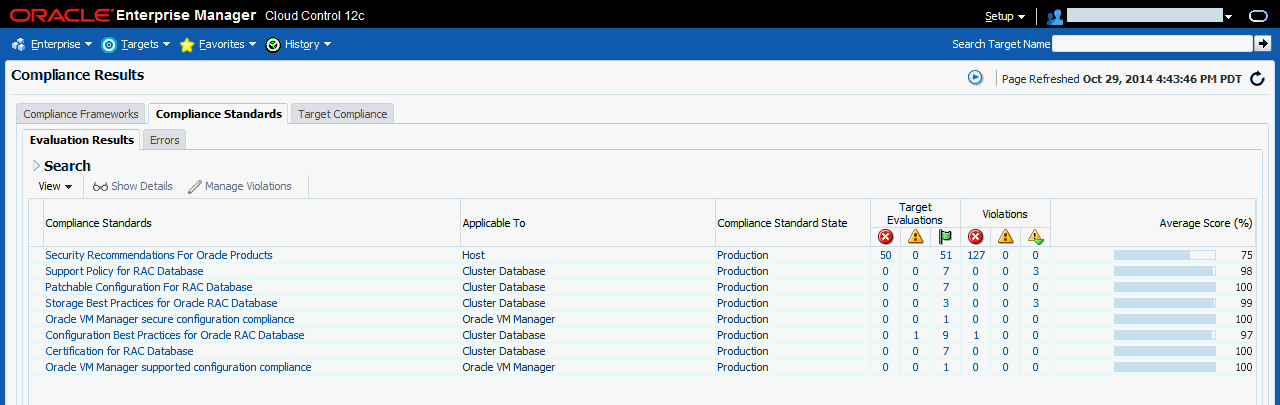
To see the results of all Compliance Standards, select Compliance then Results from the Enterprise menu, as shown in Figure 11-7.
See Also:
-
Oracle Enterprise Manager Lifecycle Management Administrator's Guide for more details on Managing Compliance
-
Oracle Enterprise Manager Cloud Control Oracle Database Compliance Standards for more details on Compliance Standards
11.3.2 Use Enterprise Manager to Manage Oracle Patches and Maintain System Baselines
Oracle recommends that production environments stay current by implementing recommended patches within six months of their release. Enterprise Manager 12c provides a patch management solution that maximizes ease of use and minimizes patching related downtime, helping administrators meet those recommendations. For the most current details on patch list recommendations for your environment, see My Oracle Support (MOS).
An online mode integrates the patch workflow with MOS, providing a consistent interface that enables Oracle patch recommendations, manual patch searches, access to MOS resources such as knowledge articles and service requests, and automatic resolution of patch conflicts using merge patches. An offline mode supports environments where Enterprise Manager cannot connect to MOS, using patches manually uploaded to the Software Library. Administrators can access MOS on systems where internet access is available, download patches to their local host, and upload the patches to the Software Library either via Enterprise Manager or through the use of the Enterprise Manager Command Line Interface (emcli).
Patch plans provide end-to-end orchestration of the patching workflow, enabling administrators to prepare, validate, and apply a list of patches as a group to one or more targets. Patch plans support one-off patches, including interim patches, diagnostic patches, Patch Set Updates (PSU), and Critical Patch Updates (CPU). Patch plans also support patch sets for some targets.
Patch plans can be tested and saved as patch templates, making it easier for multiple administrators to deploy patches consistently across multiple environments by creating their patch plans from the patch template instead of having to create patch plans from scratch.
Enterprise Manager's patch management solution supports both in-place patching, where the Oracle home is directly patched, and out-of-place patching, where the existing Oracle home is cloned and the cloned home is patched. Use out-of-place patching where supported to minimize downtime.
For some targets, including Oracle RAC, Oracle Grid Infrastructure, and Oracle Data Guard, the solution also supports patching in rolling mode, where nodes are shut down, patched, and restarted one by one, and parallel mode, where all of the nodes are shut down and the patch is applied on all nodes at the same time. Use rolling mode patching where supported to minimize downtime.
You can examine patch levels for one system and compare them between systems in either a one-to-one or one-to-many relationship. In this case, a system can be identified as a baseline and used to demonstrate maintenance requirements in other systems. This can be done for operating system patches and database patches.
See Also:
-
Oracle Enterprise Manager Lifecycle Management Administrator's Guide for information about Patching Software Deployments
-
Oracle Enterprise Manager Lifecycle Management Administrator's Guide for information about Managing Configuration Information
11.3.3 Manage Database Availability with the High Availability Console
The High Availability (HA) Console is a one stop, dashboard-style page for monitoring the availability of each database. You can use it on any database and if a database is part of a Data Guard configuration, the HA Console allows you to switch your view from the primary database to any of the standby databases.
Use the HA Console to:
-
Display high availability events including events from related targets such as standby databases
-
View the high availability summary that includes the status of the database
-
View the last backup status
-
View the Fast Recovery Area Usage, if configured
-
If Oracle Data Guard is configured: View the Data Guard summary, set up Data Guard standby databases for any database target, manage switchover and failover of database targets other than the database that contains the Management Repository, and monitor the health of a Data Guard configuration at a glance
-
If Oracle RAC is configured: View the Oracle RAC Services summary including Top Services
Figure 11-8 shows the HA Console. This figure shows summary information, details, and historical statistics for the primary database and shows the standby databases for the primary target, various Data Guard standby performance metrics and settings, and the data protection mode.
Figure 11-8 Monitoring a Primary Database in the High Availability Console
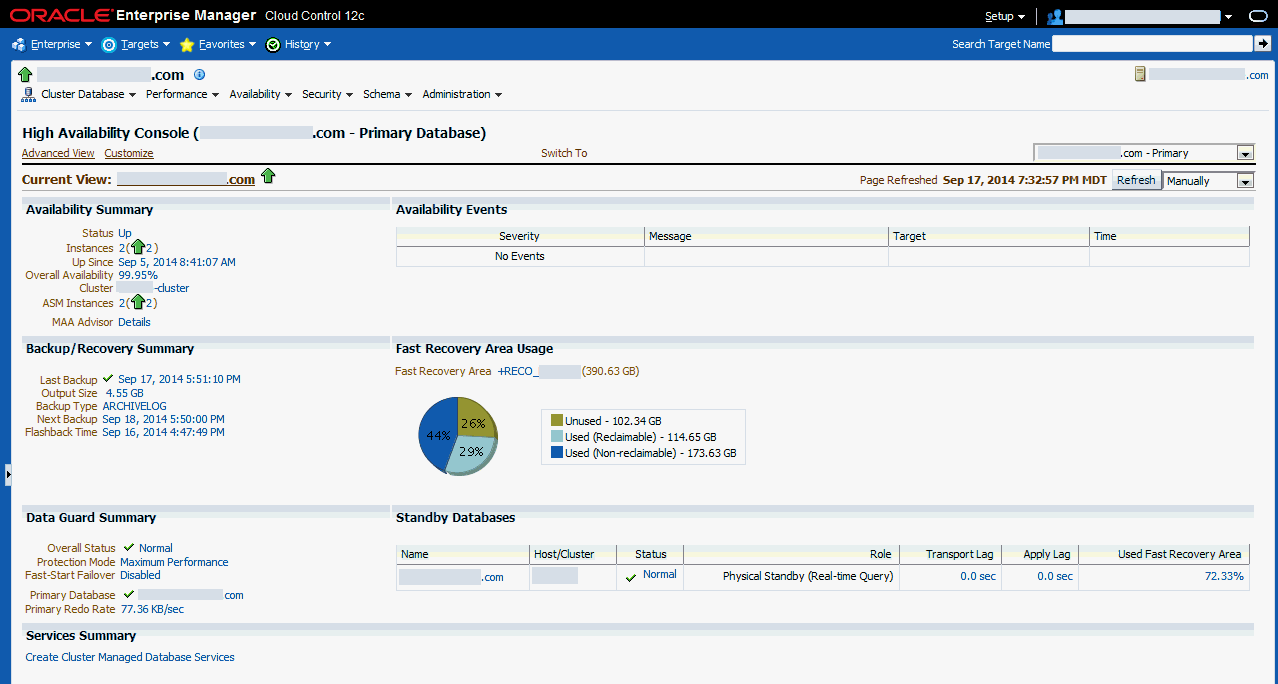
Description of "Figure 11-8 Monitoring a Primary Database in the High Availability Console"
In Figure 11-8, the Availability Summary shows that the primary database is up and its availability is currently 99.95%. The Availability Summary also shows the status of Oracle ASM instances. The Availability Events table shows specific high availability events (alerts). You can click the message to obtain more details (or to suppress the event). To set up, manage, and configure a specific solution area for this database, under Availability Summary, next to MAA Advisor, click Details to go to the Maximum Availability Architecture (MAA) Advisor page (described in more detail in Section 11.3.4, "Configure High Availability Solutions with MAA Advisor").
The Backup/Recovery Summary area displays the Last Backup and Next Backup information, including times for both and status, size, and type of the last backup. The area also includes the Flashback Time to which the database can be reset if flashback database is enabled. The Fast Recovery Area Usage area displays information about the fast recovery area. The chart indicates about 73% of the fast recovery area is currently used. You can click the chart to display the page with the metric details.
The Data Guard Summary area shows the primary database is running in Maximum Performance mode and has Fast-Start Failover disabled. You can click the link next to Protection Mode to modify the data protection mode. In the Standby Databases table, the physical standby database is caught up with the primary database (Apply/Transport Lag) metrics are showing 0 seconds, and the Used Fast Recovery Area (FRA) is 72.33%. Click on the value next to the Primary Redo Rate to view a chart that shows the redo trend. Note that if Data Guard is not configured, the "Switch To" box in the corner of the console is not displayed.
Figure 11-9 shows information similar to figure Figure 11-8, but for the standby database, which is a physical standby database running real-time query. In the Standby Databases table, the Apply/Transport Lag metrics indicate that the physical standby database is caught up with the primary database, and the Used Fast Recovery Area (FRA) is 72%. Note that if Data Guard is not configured, the "Switch To" box in the corner of the console is not displayed.
Figure 11-9 Monitoring the Standby Database in the High Availability Console
Description of "Figure 11-9 Monitoring the Standby Database in the High Availability Console"
Figure 11-10 shows sample values for Services Summary and Services Details areas. These areas show summary and detail information about Oracle RAC Services, including links to details on top activity and problem services.
Figure 11-10 Monitoring the Cluster in the High Availability Console Showing Services
Description of "Figure 11-10 Monitoring the Cluster in the High Availability Console Showing Services"
See Also:
Oracle Enterprise Manager Cloud Control Introduction for information about Database Management11.3.4 Configure High Availability Solutions with MAA Advisor
The goal of the MAA Advisor is to help you implement Oracle's best practices to achieve the optimal high availability architecture.
From the Availability Summary section on the High Availability Console, you can link to the MAA Advisor to:
-
View recommended Oracle solutions for each outage type (site failures, computer failures, storage failures, human errors, and data corruptions)
-
View the configuration status and use the links in the Oracle Solution column to go to the Enterprise Manager page where the solution can be configured.
-
Understand the benefits of each solution
-
Link to the MAA website for white papers, documentation, and other information
The MAA Advisor page contains a table that lists the outage type, Oracle solutions for each outage, configuration status, and benefits. The MAA Advisor allows you to view High Availability solutions in the following ways:
-
Recommendations Only—This condensed view shows only the recommended solutions (the default view) for the primary database.
-
All Solutions —This expanded view shows all configuration recommendations and status for all primary and standby databases in this configuration. It includes an extra column Target Name:Role that provides the database name and shows the role (Primary, Physical Standby, or Logical Standby) of the database.
Figure 11-11 shows an example of the MAA Advisor page with the Show All Solutions view selected.
Figure 11-11 Maximum Availability Architecture (MAA) Advisor Page in Enterprise Manager
Description of "Figure 11-11 Maximum Availability Architecture (MAA) Advisor Page in Enterprise Manager"
You can click the link in the Oracle Solution column to go to a page where you can set up, manage, and configure the specific solution area. Once a solution has been configured, click Refresh to update the configuration status. Once the page is refreshed, click MAA Advisor Details on the High Availability Console page to see the updated values.
11.4 Using Cluster Health Monitor
The Cluster Health Monitor (CHM) gathers operating system metrics in real time and stores them in its repository for later analysis to determine the root cause of many Oracle Clusterware and Oracle RAC issues with the assistance of Oracle Support. It also works with Oracle Database Quality of Service Management (Oracle Database QoS Management) by providing metrics to detect memory over-commitment on a node. With this information, Oracle Database QoS Management can take action to relieve the stress and preserve existing workloads.
See:
Oracle Clusterware Administration and Deployment Guide for an Overview of Managing Oracle Clusterware Environments and for more information about Cluster Health Monitor (CHM)