9.1 Understanding the Difference Between Interactive and Classic Reports
When creating a database application, you can include two types of reports: an interactive report or a classic report. The main difference between these two report types is that interactive reports enable the user to customize the appearance of the data through searching, filtering, sorting, column selection, highlighting, and other data manipulations.
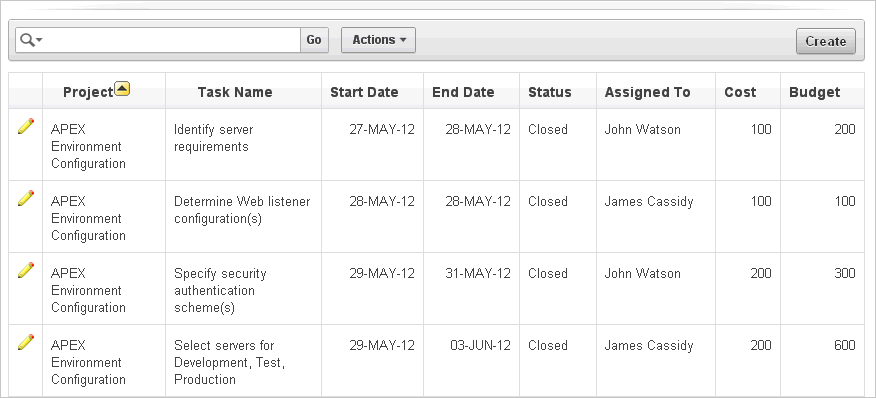
The following is an example of an interactive report.

Description of the illustration rpt_ir.gif
Interactive reports enable end users to create highly customized reports. Users can alter the report layout by hiding or exposing specific columns and applying filters, highlighting, and sorting. They can also define breaks, aggregations, charts, group bys, and add their own computations. Once customized, the report can be saved as either a private or public report. Each interactive report includes a search bar, Actions menu, Column Heading menu, and Edit icons in the first column of each row. For a complete description of these components, see "Customizing Interactive Reports".
When using an interactive report you can:
-
Include one interactive report per page
-
Display 100 columns using report columns. You can edit additional columns using Tree view or paginating through Report Column Attributes.
-
1,000,000 rows per column heading filter (if no custom LOV is specified in the column attributes)
-
Include 999 rows per column heading filter (if no custom LOV is specified in the column attributes)
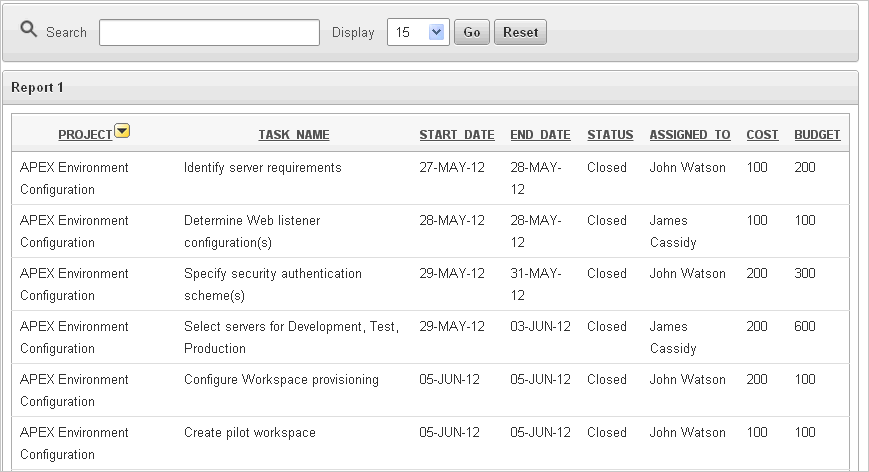
In contrast, a classic report does not support the ability to create a highly customized report. The following is an example of a classic report built on top of the same data.

Description of the illustration rpt_classic.gif
Classic reports support general keyword search capability, the ability to specify the number of rows that display, and basic column sorting.
When using a classic report, you can view 100 columns using report columns. You can edit additional columns using Tree view or paginating through Report Column attributes.
See Also:
"Editing Classic Reports"