ASH Data Comparison
This section compares the ASH data across the two runs. The begin time and end time of the comparison period are displayed in a table. These times may not match the capture and replay times of the two runs being compared. Instead, these times represent the times when the ASH samples were taken.
The ASH Data Comparison section contains the following subsections:
-
Oracle Database Performance Tuning Guide for information about ASH
Compare Summary
This section summarizes the activity during the two runs based on database time and wait time distribution:
-
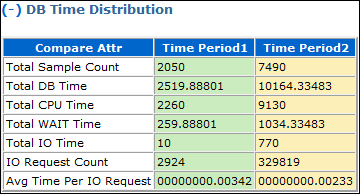
DB Time Distribution indicates how the total database time is distributed across CPU usage, wait times, and I/O requests.
Figure 13-1 shows the DB Time Distribution subsection of a sample report.
-
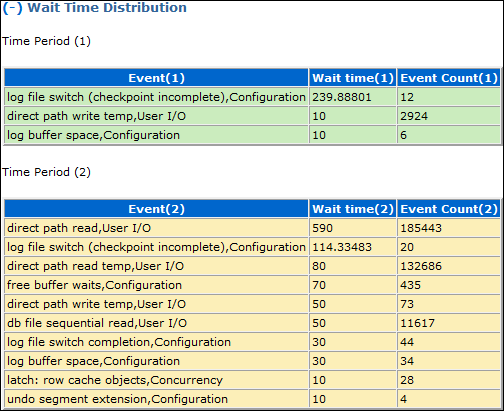
Wait Time Distribution indicates how the total wait time is distributed across wait events. The top wait event class, event name, and event count are listed for both runs.
Figure 13-2 shows the Wait Time Distribution subsection of a sample report.
Top SQL
This section displays the top SQL statements for both runs by total database time, CPU time, and wait time.
Long Running SQL
This section displays the top long-running SQL statements for both runs. Each long-running SQL statement contains details about the query, such as the maximum, minimum, and average response times.
Common SQL
This section extracts the SQL statements that are common in both runs and displays the top common SQL statements by variance in average response time and total database time.
Top Objects
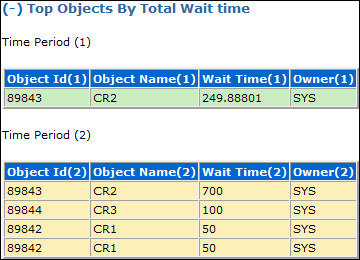
This section contains details about the top objects for both runs by total wait time.
Figure 13-3 shows the Top Objects section of a sample report.


