Reviewing the SQL Performance Analyzer Report Using Oracle Enterprise Manager
When a SQL Performance Analyzer task is completed, the resulting data is generated into a SQL Performance Analyzer report that compares the pre-change and post-change SQL performance.
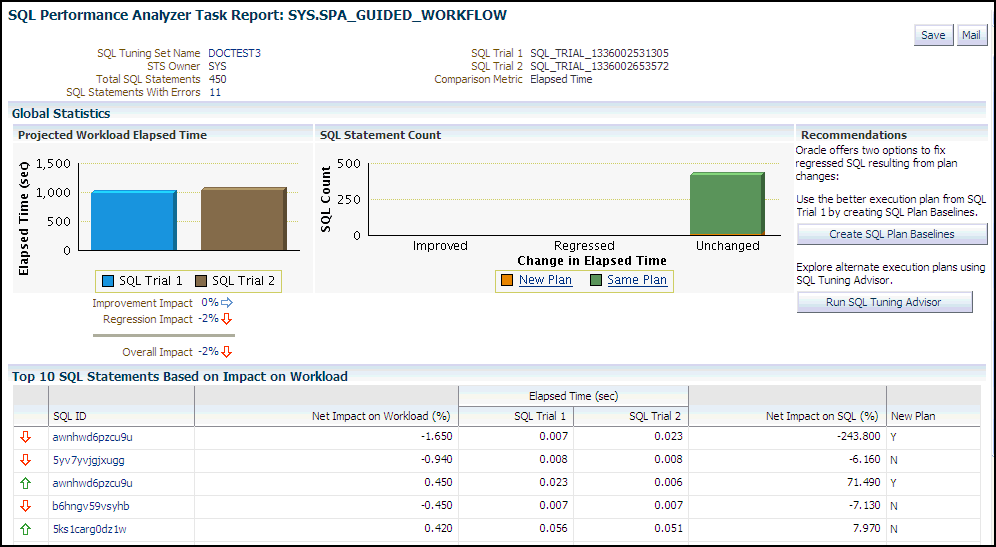
Figure 6-1 shows a sample SQL Performance Analyzer report. This sample report uses the elapsed time comparison metric to compare the pre-change and post-change executions of a SQL workload.
Figure 6-1 SQL Performance Analyzer Report

Description of "Figure 6-1 SQL Performance Analyzer Report"
Before you can view the SQL Performance Analyzer report, compare the pre-change version of performance data with the post-change version, as described in "Comparing SQL Trials Using Oracle Enterprise Manager"
To generate and review the SQL Performance Analyzer report:
-
From the Performance menu, select SQL, then SQL Performance Analyzer.
If the Database Login page appears, then log in as a user with administrator privileges.
The SQL Performance Analyzer page appears. A list of existing SQL Performance Analyzer tasks are displayed.
-
Under SQL Performance Analyzer Tasks, select the task for which you want to view a SQL Performance Analyzer report and click View Latest Report.
The SQL Performance Analyzer Task Report page appears.
-
Review the general information about the performance analysis, as described in "Reviewing the SQL Performance Analyzer Report: General Information".
-
Review general statistics, as described in "Reviewing the SQL Performance Analyzer Report: Global Statistics".
-
Optionally, review the detailed statistics, as described in "Reviewing the SQL Performance Analyzer Report: Global Statistics Details".
-
To generate an active report, click Save to generate and save the report, or Mail to generate and mail the report as an HTML attachment.
Active reports include information about the top SQL statements from each category (such as improved, regressed, and changed plans) with pre-change and post-change statistics, explain plans, and task summary.
For more information, see "About SQL Performance Analyzer Active Reports".