5 Working with the TimesTen Database Home Page
This chapter describes the TimesTen database home page. The TimesTen database home page conveys high level configuration and performance information about your TimesTen database.
Topics include:
Viewing the TimesTen home page
To view the home page, ensure that you are on the TimesTen database target page. For information on navigating to the TimesTen database target page, see "Navigating to the TimesTen target page".
From the TimesTen Database Home menu, select Home.
The TimesTen database home page displays.
Analyzing information on the TimesTen home page
The TimesTen home page consists of three regions each of which has been customized specifically for TimesTen database targets.
The three home page regions described in detail include:
Status and Summary
The Status and Summary region consists of three subregions:
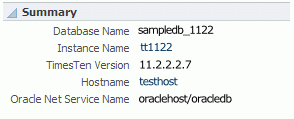
Summary
This region shows information about your TimesTen target:
-
Database name
This value is taken from the last part of the path to the database. For example, if the path to the database is
/var/tt/sampledb_1122, the database name issampledb_1122. -
Instance name
The name of your current TimesTen instance. This is a link that lets you view the TimesTen instance target page.
-
TimesTen version
The version of your current TimesTen instance.
-
Hostname
The name of the host where TimesTen is running. This is a link that lets you view the host target page.
-
Oracle Net Service Name
The service name of the Oracle database used for cache and to load data from an Oracle database into the TimesTen database. If you have not configured the Oracle Net Service Name, then this value is Not Specified.
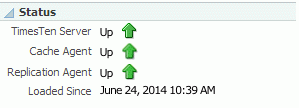
Status
This region shows status information including:
-
TimesTen Server
This value can be either Up or Down. The TimesTen Server is the listener process that enables client/server connections to the database. For more information on how to start and stop the TimesTen server, see "Start/stop services".
-
Cache Agent
This value can be either Up or Down. If you have not configured a cache group, then this value is Down. The Cache Agent is used for read or write caching of data in an Oracle database. For more information, on how to start and stop the cache agent, see "Start/stop agents".
-
Replication Agent
This value can be either Up or Down. If you have not configured a replication scheme, then this value is Down. TimesTen uses the Replication Agent to either replicate data between TimesTen databases or to asynchronously write data to an Oracle database. For more information, on how to start and stop the replication agent, see "Start/stop agents".
-
Loaded Since
The date and time when the database was loaded into memory.
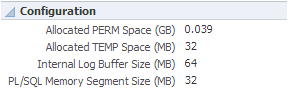
Configuration
This region shows configuration information specific to your database. These attributes are first connection attributes and the values are set at first connect. For more information on first connection attributes, see "Connection Attributes" in the Oracle TimesTen In-Memory Database Reference.
-
Allocated PERM Space
-
Allocated TEMP Space
-
Internal Log Buffer Size
-
PL/SQL Memory Segment Size
Performance Overview and Issues
The Performance Overview and Issues region consists of two tabs:
Performance Overview
The Performance Overview region consists of three subregions:
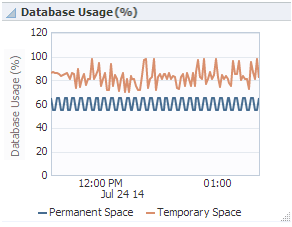
Database Usage (%)
This region uses a line graphs to show permanent and temporary space currently in use. The values are expressed as a percentage of what was configured at database first connect. For information on the configured values, see the Summary, Status, and Configuration regions.
The X-Axis represents time. The Y-Axis represents the percent of permanent space in use and the percent of temporary space in use.
High database usage may indicate the need to grow the database by allocating more permanent or temporary space.
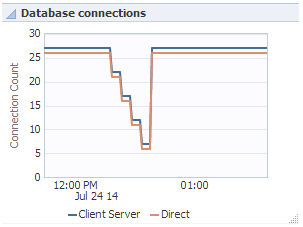
Database Connections
This region uses a line graph to show the number of direct linked connections and client/server connections. These line graphs change according to time to show not only the current value but also the values collected in recent metric collections.
The X-Axis represents time. The Y-Axis represents the number of current direct linked connections and the number of client/server connections. These connections do not include subdaemon connections or connections created by the TimesTen plug-in to collect configuration and performance data.
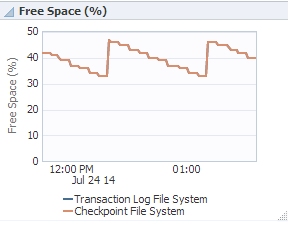
Free Space (%)
This region uses a graph to show the free space in the file systems where the checkpoint and transaction log files are currently located.
The X-Axis represents time. The Y-Axis represents the free space in the checkpoint file system and the free space in the transaction log file system. If you configured the checkpoint and transaction log files in the same file system and path, the two lines will be on top of each other and you will see one line.
A very low percentage of free disk available may indicate a need to install a larger disk.
SQL Execution Time and Monitor
The SQL Execution Time and Monitor consists of two tabs.
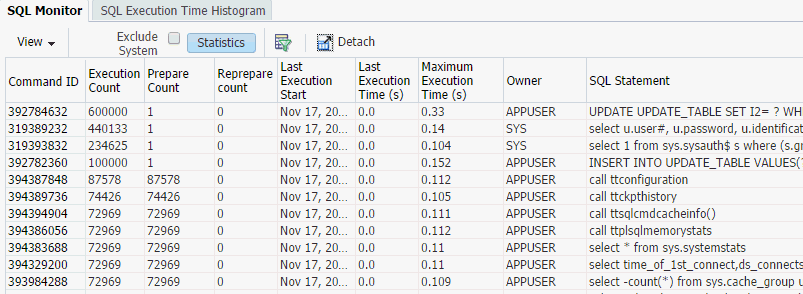
SQL Monitor
This regions shows the top SQL statements in the SQL command cache expressed in table format. This information is useful in analyzing your queries. It may be useful to sort by the number of executions to see the SQL statements that are most executed. It may also be useful to exclude system SQL commands by clicking in the box to the left of Exclude System.
As you review the top executions, look at the values in the Prepare Count column. If the SQL query is not prepared, then you should prepare the query. For optimal performance, a SQL statement should be prepared once and executed many times. If the number of prepares for a SQL statement is large then verify if your application can be enhanced to minimize the number of prepares per SQL statement.
Click the Statistics button at the top of the table to view the number of cached commands and the current space allocated to store cached commands. This information is derived from the output values of the ttSQLCmdCacheInfo2 built-in procedure. For more information about the ttSQLCmdCacheInfo2 built-in procedure, see "ttSQLCmdCacheInfo2" in the Oracle TimesTen In-Memory Database Reference.
Click the Query By Example at the top of the table to enable query fields for the Owner and SQL Statement columns.
In addition, you can review the queries in the SQL Statement column. You can copy and paste this SQL query into the worksheet in SQL Developer and review the results from Explain Plan. You can also paste the SQL query into ttIsql and look at the showplan for the query. This may give you a better understanding of how and why your queries are performing as they are.
You can also click the column header to sort the table based on the column. A description of each column follows:
Note:
The columns are sorted based on the rows that are currently loaded in the SQL Monitor table. To sort the table based on all the rows from thettSQLCmdCacheInfo2 built-in procedure, ensure that you are viewing data in Real Time. For more information on viewing data in Real Time, see "View data".-
Command ID
A unique identifier for the SQL command. The TimesTen database generates this number.
-
Execution Count
A counter for the number of executions that took place on this command since it was brought into the command cache.
-
Prepare Count
A counter for the number of prepares for a SQL statement.
-
Reprepare count
A counter of the number of reprepares.
-
Last Execution Time (s)
The last execution time for a SQL statement.
-
Maximum Execution Time (s)
The maximum execution time for a SQL statement.
-
Owner
The identifier of the user who created the command.
-
SQL Statement
The SQL text.
SQL Execution Time Histogram
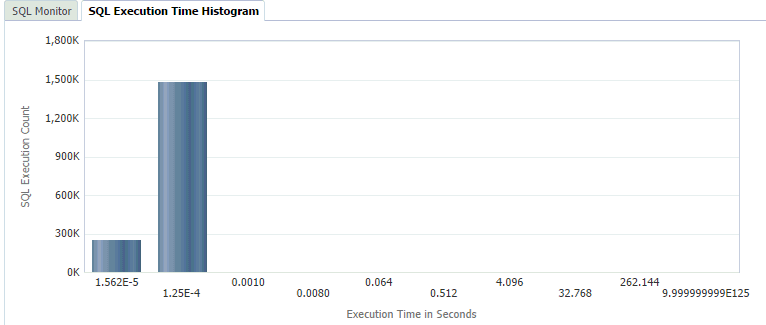
Figure 5-9 SQL Execution Time Histogram region
Description of "Figure 5-9 SQL Execution Time Histogram region"
This region shows a histogram with the number of SQL commands that have been executed since command cache sampling has been enabled. The histogram is populated with output of the ttSQLExecutionTimeHistogram built-in procedure. For more information on the ttSQLExecutionTimeHistogram built-in procedure, see "ttSQLExecutionTimeHistogram" in the Oracle TimesTen In-Memory Database Reference.
The histogram is populated when the TimesTen database is configured to take sample SQL command cache. To enable TimesTen to take sample SQL command caches, call the ttStatsConfig built-in procedure with the SQLCmdSampleFactor parameter set to a value that is between 0 and 60000. For more information about the ttStatsConfig built-in procedure, see "ttStatsConfig" in the Oracle TimesTen In-Memory Database Reference.
For example, call the ttStatsConfig built-in procedure with the following parameters and values to enable command cache sampling for every single SQL command:
Command> call ttStatsConfig('SqlCmdSampleFactor',1);
< SQLCMDSAMPLEFACTOR, 1 >
1 row found.
The histogram has the following fixed interval times:
-
0 seconds to .00001562 seconds
-
.00001562 seconds to .000125 seconds
-
.0000125 seconds to .001 seconds
-
.001 seconds to .008 seconds
-
.008 seconds to .064 seconds
-
.064 seconds to .512 seconds
-
.512 seconds to 4.096 seconds
-
4.096 seconds to 32.768 seconds
-
32.768 seconds to 262.144 seconds
-
262.144 seconds to 9.999999999E+125 seconds
To reset the SQL execution time histogram, call the ttStatsConfig built-in procedure with the SQLCmdHistogramReset parameter set to a value that is not 0. For more information about the ttStatsConfig built-in procedure, see "ttStatsConfig" in the Oracle TimesTen In-Memory Database Reference.
For example, call the ttStatsConfig built-in procedure with the following parameters and values to reset the SQL execution time histogram:
Command> call ttStatsConfig('SQLCmdHistogramReset',1);
< SQLCMDHISTOGRAMRESET, 1 >
1 row found.
