2 Working with the TimesTen Target Page
The TimesTen plug-in collects many metrics that are useful in troubleshooting performance issues. The TimesTen target page displays a collective view of your database or instance, the performance of your database, and control operations for your instance.
This chapter details the procedure for navigating to the TimesTen target page and provides an overview of the TimesTen target page.
Topics include:
Navigating to the TimesTen target page
To navigate to the TimesTen target page:
-
From the Targets menu, select All Targets on the Enterprise Manager Cloud Control 12c home page.
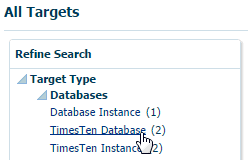
The All Targets page displays. Locate the Refine Search panel under All Targets.
-
Expand Target Type, then Databases and click TimesTen Instance or TimesTen Database.
The target table displays. For each row in the table, confirm the column Target Type contains TimesTen Instance or TimesTen Database. The number of rows depends on the number of TimesTen targets you have configured. For example, if you configured two TimesTen targets, then you should see two rows in the table.
-
In the column Target Name, identify the TimesTen target you want to review, and click the Target Name. The target name is the name of the TimesTen target you configured.
The TimesTen target page displays. For more information on the TimesTen instance target page, see "Overview of the TimesTen instance target page". For more information on the TimesTen database target page, see "Overview of the TimesTen database target page".
Overview of the TimesTen instance target page
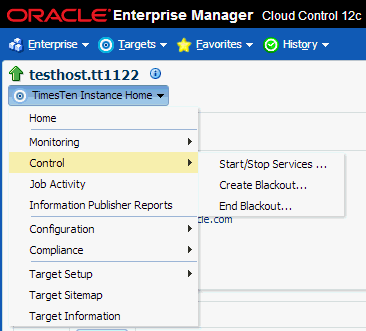
The TimesTen instance target page enables you to gather monitoring and metrics information specific to TimesTen instances and control the TimesTen daemon and server. Figure 2-3, "TimesTen instance target page" shows Enterprise Manager Cloud Control menu choices and menu choices that have been customized for TimesTen instance targets.
A description of the menu choices that have been customized for TimesTen instance targets follows:
-
Home
Displays high level information about the TimesTen instance. For more information, see Chapter 4, "Working with the TimesTen Instance Home Page".
-
Monitoring - All Metrics
Displays TimesTen instance metric information in table format. For more information, see "Viewing TimesTen instance metrics".
-
Control - Start/Stop Services
Displays controls to start and stop the TimesTen daemon and server. For more information, see "Start/stop services".
-
Control - Create Blackout
Displays controls to create a blackout to suspend all data collection activity on a target that is monitored by Enterprise Manager. For more information, see "Create blackout".
-
Control - End Blackout
Displays controls to end a blackout and resume all data collection activities on a target that is monitored by Enterprise Manager. For more information, see "End blackout".
Overview of the TimesTen database target page
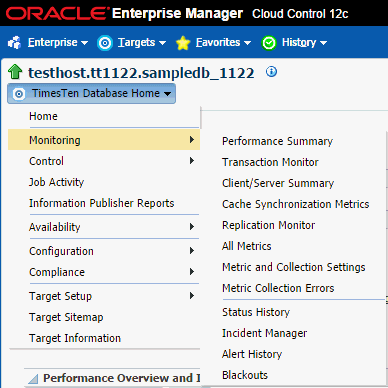
The TimesTen database target page enables you to gather monitoring and metrics information specific to TimesTen database targets and control various functions of the TimesTen database. Figure 2-4, "TimesTen target page" shows Enterprise Manager Cloud Control menu choices and menu choices that have been customized for TimesTen database targets.
A description of the menu choices that have been customized for TimesTen targets follows:
-
Home
Displays high level performance metrics and configuration data. For more information, see Chapter 5, "Working with the TimesTen Database Home Page."
-
Monitoring - Performance Summary
Displays performance metrics in graphical format. For more information, see Chapter 6, "Working with the Performance Summary Page."
-
Monitoring - Transaction Monitor
Displays a snapshot of the current transactions in your TimesTen database and describes details about your transactions. For more information, see Chapter 7, "Working with the Transaction Monitor".
-
Monitoring - Client/Server Summary
Displays client/server information about your database. For more information, see Chapter 8, "Working with the Client/Server Page".
-
Monitoring - Cache Synchronization Metrics
Displays cache synchronization metrics. For more information, see Chapter 12, "Working with the Cache Synchronization Metrics Page."
-
Monitoring - Replication Monitor
Displays information for monitoring replication. For more information, see Chapter 13, "Working with the Replication Monitor."
-
Monitoring - All Metrics
Displays metric information about your TimesTen database target in table format. For more information, see "Viewing TimesTen database metrics".
-
Control - Start/Stop Agents
Displays controls to start and stop the cache and replication agents. For more information, see "Start/stop agents".
-
Control - Ram Load/Unload and Policy Settings
Displays controls to control and configure the RAM policy of the TimesTen database. For more information, see "Ram load/unload and policy settings".
-
Control - Create Blackout
Displays controls to create a blackout to suspend all data collection activity on a target that is monitored by Enterprise Manager. For more information, see "Create blackout".
-
Control - End Blackout
Displays controls to end a blackout and resume all data collection activities on a target that is monitored by Enterprise Manager. For more information, see "End blackout".
-
Information Publisher Reports
Displays reports about your TimesTen database. For more information, see Chapter 16, "Viewing Reports."
-
Availability - Backup & Restore
Displays controls to backup and restore the TimesTen database. For more information, see Chapter 11, "Working with the Backup and Restore Page".
Setting the display time period and auto refresh rate of data on a target page
Enterprise Manager enables you to set the display frequency and auto refresh rate of data on a target page.
Figure 2-5 View Data and Auto Refresh region

Description of "Figure 2-5 View Data and Auto Refresh region"
You can set the time period and auto refresh rate of data with the following options:
View data
The View Data option enables you to view data on a target page based on a historical time period or in real time. This option is not available on all TimesTen target pages and only affects graphs. When a TimesTen target page has a View Data option it is located in the top right corner of the page with the following options:
-
Real Time
-
Last 2 Hours
-
Last 24 Hours
-
Last 7 Days
-
Last 31 Days
-
Custom Time Period...
By default, every TimesTen target page uses a view data time period of Last 24 Hours. It is recommended to use the Real Time option of View Data when monitoring a TimesTen target.
Auto refresh
The Auto Refresh option enables you to control the auto refresh rate of a target page. This option is available on all TimesTen target pages and affects the whole target page. The Auto Refresh option is located in the top right corner of the target page and the options vary depending on the value of the View Data option.
Viewing the log of control operations
Enterprise Manager logs all control operations that are performed on Enterprise Manager targets. In some cases it is useful to review these logs.
-
From the Targets menu, select All Targets on the Enterprise Manager Cloud Control 12c home page.
-
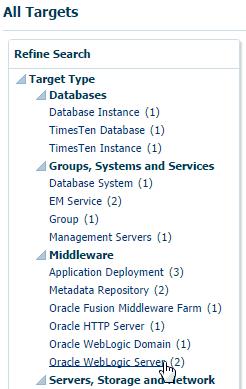
Expand Target Type, then Middleware and click Oracle WebLogic Server.
The target table displays. For each row in the table, confirm the column Target Type contains Oracle WebLogic Server.
-
In the column Target Name, identify the Oracle WebLogic Server target that manages your OMS, and click the Target Name. Typically this target name is
/EMGC_EMGC_DOMAIN/EMGC_DOMAIN/EMGC_OMS1.The WebLogic Server target page displays. Locate the WebLogic Server menu.
-
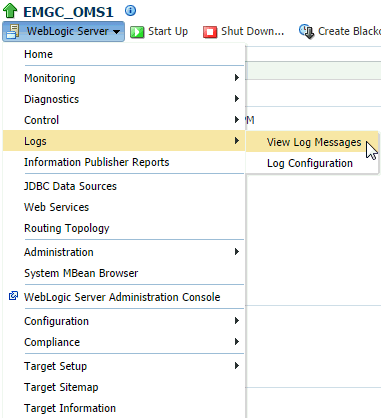
From the WebLogic Server menu, select Logs, then View Log Messages.
The Log Messages page displays. Locate the Search Mode field in the Search region.
-
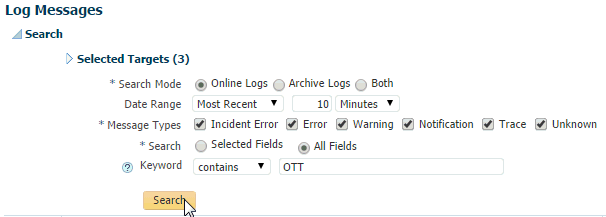
In the *Search Mode field, select the Online Logs option. If you want to search through archived logs or both types of logs, select Archive Logs or Both.
-
In the Date Range field, select an appropriate date range.
-
In the *Message Types field, select the type of messages that you want to search through. It is recommended to check all message types. TimesTen control operations are logged in trace files.
-
In the *Search field, select All Fields.
-
In the Keyword field, select contains from the drop-down list and enter OTT in the text field.
-
Click Search.
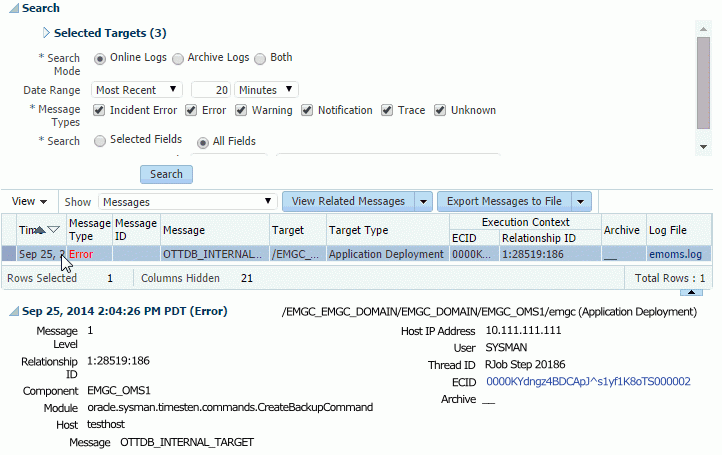
A processing dialog displays. The search can take several minutes. You should see your search results in the table below the Search region. Locate issues that you want to review.
-
Click in the row that identifies the issue that you want to troubleshoot.
Troubleshoot the issues with the details that are displayed in the results region that is located at the bottom of the page.
