Monitoring Performance Using the Performance Hub
The Performance Hub allows you to view all the performance data available for a specified time period. Once a time period is selected, the performance information is collected and presented based on performance subject areas.
This section includes the following topic:
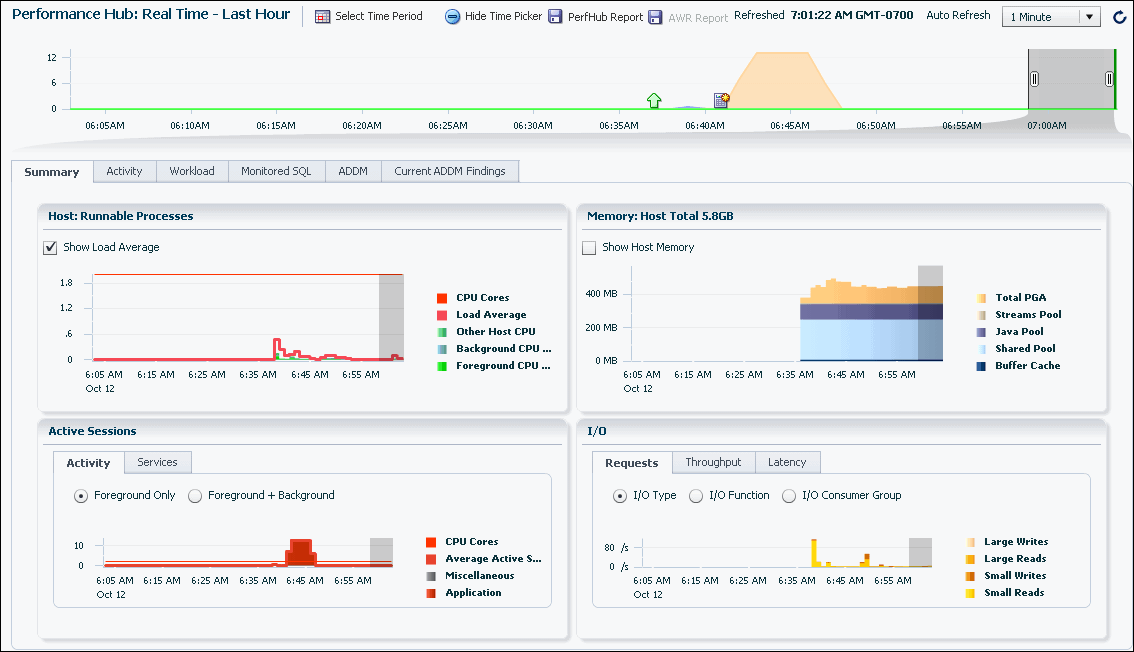
When real-time data is selected, more granular data is presented (because data points are available every minute).
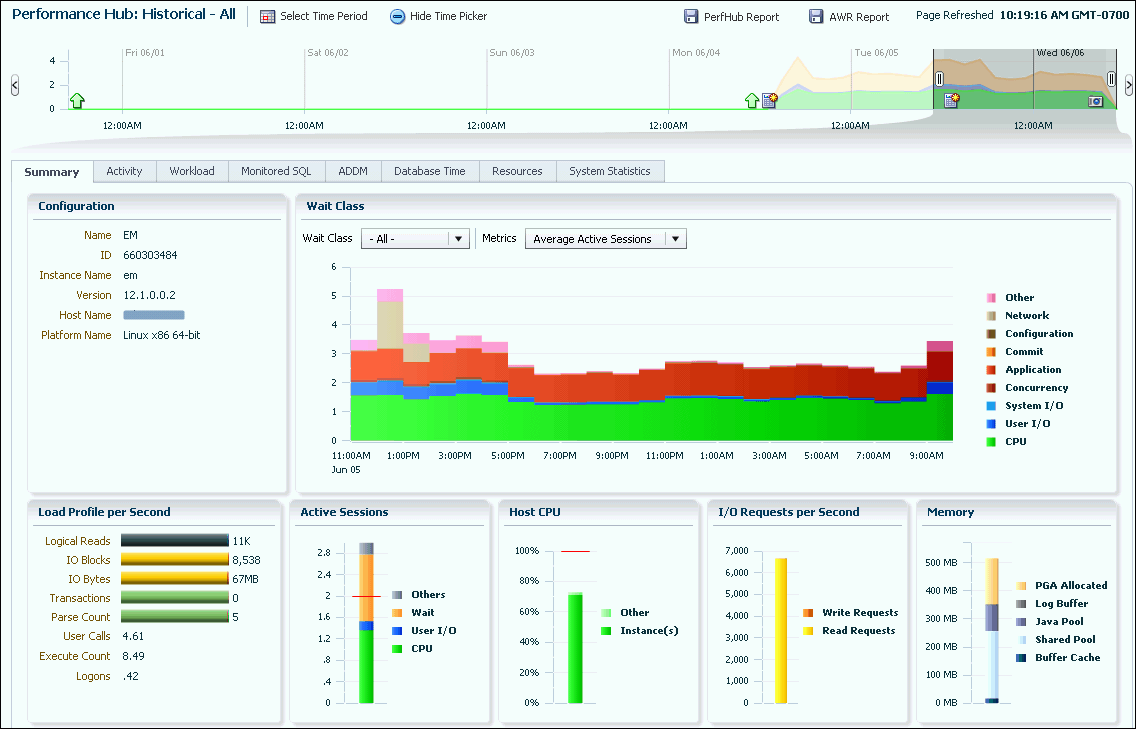
When historical data is selected, more detailed data (broken down by different metrics) is presented, but the data points are averaged out to the Automatic Workload Repository (AWR) interval (usually an hour).
Different tabs are available in the Performance Hub, depending on whether real-time or historical data is selected for the time period.
The following table describes the Performance Hub tabs, and indicates whether the tab is available when real-time data is selected or historical data is selected, or both.
| Performance Hub Tab Name | Description | Available When |
|---|---|---|
|
Summary |
The Summary tab provides an overall view of the performance of the system for the specified time period. When real-time data for the last hour is displayed in the Performance Hub page, this tab shows a summary of running processes, memory allocation, database activity by category, and I/O data during the last hour. When historical data is displayed in the Performance Hub page, this tab shows a summary of average active session waits by category, load profile per second, active session activity, host CPU usage by the database instance and other processes, I/O read and write requests per second, and memory usage during the selected time period. |
Real-time data or historical data is selected in the Select Time Period field |
|
RAC |
The RAC tab appears only when EM Express is being used with an Oracle RAC database (or cluster database). When real-time data is selected, this tab shows global cache activity information and a breakdown of activity (average active sessions) and resource usage (CPU, I/O, memory) per instance. When historical data is selected, this tab shows global cache activity information and a breakdown of activity (average active sessions) and resource usage (CPU, I/O, memory) per instance during the selected time period. |
Real-time data or historical data is selected in the Select Time Period field |
|
Activity |
The Activity tab shows Active Session History (ASH) analytics. It allows detailed drilldown into average active sessions for ASH over the selected time period. This tab enables you to select an average active sessions dimension and view the top activity for that dimension for a selected time period. For example, you can view the SQL statements and user sessions that had the top average active sessions activity for the selected time period. |
Real-time data or historical data is selected in the Select Time Period field |
|
Workload |
The workload profile charts show the pattern of user calls, parse calls, Redo Size and SQL*Net over the last 60 minutes in real-Time mode. The Sessions chart show the logon rate, current logons and open cursors. Clicking a SQL_ID displays the SQL Details page with more information about that SQL statement. |
Real-time data or historical data is selected in the Select Time Period field |
|
Monitored SQL |
This tab enables you to view information about monitored SQL statements that were executing or that completed during the selected time period. The table displays information about monitored SQL statement executions. If there is a green spinning icon in the Status column, then the monitored statement did not complete during the selected time period. A red cross indicates that the SQL did not complete either due to an error or due to the session getting terminated. If there is a check mark in the Status column, then the statement completed its execution during the selected time period. SQL statements are monitored only if they have consumed at least 5 seconds of CPU or I/O time. You can view information such as the status of a statement, its duration, its type (SQL, PL/SQL, or DBOP), its SQL ID, its SQL plan hash, the user who issued it, whether it executed as a serial or parallel statement, the time the database spent performing CPU activity, I/O, or other activity for the statement, the read and write requests and bytes associated with the statement, and the start and end time for the statement. Click a SQL ID to display the SQL Details page with more information about that SQL statement. |
Real-time data or historical data is selected in the Select Time Period field |
|
ADDM |
The ADDM tab enables you to view performance findings and recommendations that have been found by Automatic Database Diagnostics Monitor (ADDM) for tasks performed in the database during the selected time period. See "Performance Self-Diagnostics: Automatic Database Diagnostic Monitor " for more information about ADDM features. |
Real-time data or historical data is selected in the Select Time Period field |
|
Current ADDM Findings |
The Current ADDM Findings tab enables you to view Real-time ADDM findings for the past five minutes. See "Performance Self-Diagnostics: Automatic Database Diagnostic Monitor " for more information about ADDM features. |
Real-time data is selected in the Select Time Period field |
|
Database Time |
The Database Time tab enables you to view wait events by category for various metrics, and to view time statistics for various metrics for the selected time period. |
Historical data is selected in the Select Time Period field |
|
Resources |
The Resources tab enables you to view operating system resource usage statistics, I/O resource usage statistics, and memory usage statistics for the selected time period. |
Historical data is selected in the Select Time Period field |
|
System Statistics |
The System Statistics tab enables you to view database statistics by value, per transaction, or per second for the selected time period. |
Historical data is selected in the Select Time Period field |
The following figure shows the Performance Hub when Real Time - Last Hour data is selected.
The following figure shows the Performance Hub when historical data is selected.
To view Performance Hub data:

