Using the Optimizer Statistics Workflow
The optimizer statistics workflow enables you to analyze the effects of optimizer statistics changes on the performance of a SQL workload.
SQL Performance Analyzer tests the effect of new optimizer statistics by enabling pending optimizer statistics in the testing session. The first SQL trial measures the baseline SQL tuning set performance; the second SQL trial uses the pending optimizer statistics. You can then run a comparison report for the two SQL trials.
To use the optimizer statistics workflow:
-
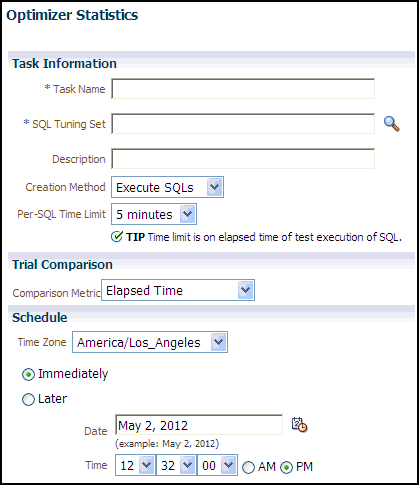
On the SQL Performance Analyzer page, under SQL Performance Analyzer Workflows, click Optimizer Statistics.
The Optimizer Statistics page appears.
-
In the Task Name field, enter the name of the task.
-
In the SQL Tuning Set field, enter the name of the SQL tuning set that contains the SQL workload to be analyzed.
Alternatively, click the search icon to search for a SQL tuning set using the Search and Select: SQL Tuning Set window.
The selected SQL tuning set now appears in the SQL Tuning Set field.
-
In the Description field, optionally enter a description of the task.
-
In the Creation Method list, determine how the SQL trial is created and what contents are generated by performing one of the following actions:
-
Select Execute SQLs.
The SQL trial generates both execution plans and statistics for each SQL statement in the SQL tuning set by actually running the SQL statements.
-
Select Generate Plans.
The SQL trial invokes the optimizer to create execution plans only without actually running the SQL statements.
-
-
In the Per-SQL Time Limit list, determine the time limit for SQL execution during the trial by performing one of the following actions:
-
Select 5 minutes.
The execution will run each SQL statement in the SQL tuning set up to 5 minutes and gather performance data.
-
Select Unlimited.
The execution will run each SQL statement in the SQL tuning set to completion and gather performance data. Collecting execution statistics provides greater accuracy in the performance analysis but takes a longer time. Using this setting is not recommended because the task may be stalled by one SQL statement for a prolonged time period.
-
Select Customize and enter the specified number of seconds, minutes, or hours.
-
-
In the Comparison Metric list, select the comparison metric to use for the comparison analysis:
-
Elapsed Time
-
CPU Time
-
User I/O Time
-
Buffer Gets
-
Physical I/O
-
Optimizer Cost
-
I/O Interconnect Bytes
Optimizer Cost is the only comparison metric available if you chose to generate execution plans only in the SQL trials.
To perform the comparison analysis by using more than one comparison metric, perform separate comparison analyses by repeating this procedure with different metrics.
-
-
Ensure that pending optimizer statistics are collected, and select Pending optimizer statistics collected.
-
In the Schedule section:
-
In the Time Zone list, select your time zone code.
-
Select Immediately to start the task now, or Later to schedule the task to start at a time specified using the Date and Time fields.
-
-
Click Submit.
The SQL Performance Analyzer page appears.
In the SQL Performance Analyzer Tasks section, the status of this task is displayed. To refresh the status icon, click Refresh. After the task completes, the Status field changes to Completed.
-
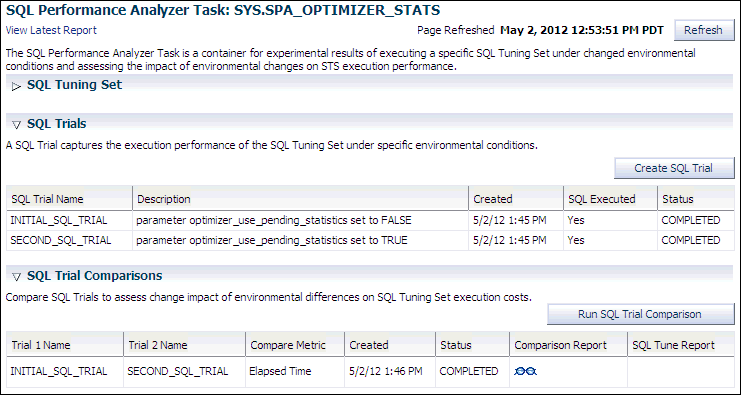
In the SQL Performance Analyzer Tasks section, select the task and click the link in the Name column.
The SQL Performance Analyzer Task page appears.
This page contains the following sections:
-
SQL Tuning Set
This section summarizes information about the SQL tuning set, including its name, owner, description, and the number of SQL statements it contains.
-
SQL Trials
This section includes a table that lists the SQL trials used in the SQL Performance Analyzer task.
-
SQL Trial Comparisons
This section contains a table that lists the results of the SQL trial comparisons
-
-
Click the icon in the Comparison Report column.
The SQL Performance Analyzer Task Result page appears.
-
Review the results of the performance analysis, as described in "Reviewing the SQL Performance Analyzer Report Using Oracle Enterprise Manager".
Any regressions found in performance can be fixed using SQL plan baselines and the SQL Tuning Advisor. If the pending optimizer statistics produce satisfactory performance, you can publish for use.


