5 Monitoring Real-Time Database Operations
This chapter describes how to monitor current and recent database operations in Oracle Enterprise Manager Cloud Control (Cloud Control). This chapter contains the following topics:
See Also:
-
Oracle Database SQL Tuning Guide for information on monitoring database operations using an API
About Monitoring Database Operations
The SQL Monitoring pages in Cloud Control display information that you can use to monitor the performance of database operations while they are executing, view details about the time and resources used for recently completed operations, and track and report on database operations. A database operation is a set of database tasks defined by end users or application code such as a SQL statement or PL/SQL function, a batch job, or extract, transform, and load (ETL) processing. You can define, monitor, and report on database operations.
This section contains the following topics:
See Also:
-
Oracle Database SQL Tuning Guide for more information about monitoring database operations
Types of Database Operations
Database operations are either simple or composite. A simple database operation is a single SQL statement or PL/SQL procedure or function. Monitoring of a simple operation starts automatically when a SQL statement runs in parallel, or when it has consumed at least 5 seconds of CPU or I/O time in a single execution.
A composite database operation is activity between two defined points in time in a database session. You begin and end a composite operation by using PL/SQL procedures, as shown in "Creating a Database Operation". Only one composite database operation at a time can run in a database session.
Purposes of Monitoring Database Operations
In general, database operation monitoring is useful for the following users:
-
DBAs whose responsibilities include identifying expensive (high response time) SQL statements and PL/SQL functions
-
DBAs who manage batch jobs in a data warehouse or OLTP system
-
Application or database developers who need to monitor the activities related to particular operations, for example, Data Pump operations
Monitoring database operations is useful for performing the following tasks:
-
Tracking and reporting
Tracking requires first defining a composite database operation. When the operation begins, the database infrastructure determines what to track on behalf of the operation. For example, your tuning task may involve determining which SQL statements run on behalf of a specific batch job, what their execution statistics were, what was occurring in the database when the operation was executing, and so on. In Cloud Control, you can view the reports for the composite database operation and for the simple database operations that comprise the composite database operation. You can save the reports to disk.
-
Monitoring execution progress
This task involves monitoring a currently executing database operation. The information is particularly useful when you are investigating why an operation is taking a long time to complete.
-
Monitoring resource usage
You may want to detect when a SQL execution uses excessive CPU, issues an excessive amount of I/O, or takes a long time to complete. With Oracle Database Resource Manager (Resource Manager), you can configure thresholds for each consumer group that specify the maximum resource usage for all SQL executions in the group. When a SQL operation reaches a specified threshold, Resource Manager can switch the operation into a lower-priority consumer group, terminate the session or call, or log the event. In Cloud Control, you can examine these SQL operations. For information on consumer group switching, see Oracle Database Administrator's Guide.
-
Tuning for response time
When tuning a database operation, you typically want to improve the response time. Often the database operation performance issues are mainly SQL performance issues.
Enabling Monitoring of Database Operations
Real-time database operations monitoring is enabled by default when the STATISTICS_LEVEL initialization parameter is either set to TYPICAL (the default value) or ALL. Because database operations monitoring is a feature of the Oracle Database Tuning Pack, the CONTROL_MANAGEMENT_PACK_ACCESS parameter must be set to DIAGNOSTIC+TUNING (the default value). For information on how to disable the monitoring, see Oracle Database SQL Tuning Guide.
Attributes of Database Operations
A database operation has attributes that uniquely identify it. These attributes are the following:
-
Database operation name
This is a user-created name such as
daily_sales_report. For an example of naming a database operation, see "Creating a Database Operation". -
Database operation execution ID
Two or more occurrences of the same database operation can run at the same time, each in a different database session, with the same name but with different execution IDs. This numeric ID uniquely identifies different executions of the same database operation.
The database automatically creates an execution ID when you begin a database operation. You can also specify your own execution ID.
Creating a Database Operation
A composite database operation can be created by using procedures in the PL/SQL package DBMS_SQL_MONITOR.
Example 5-1 creates a database operation named DBOP_EXAMPLE. The example begins the database operation. It has a PL/SQL procedure that selects the maximum sales amount by customer by city. It then has a SQL statement that selects the maximum sales amount of all customers from cities that have at least two customers. Finally, it ends the database operation.
Example 5-1 Creating a Database Operation
VAR eid NUMBER
EXEC :eid := DBMS_SQL_MONITOR.BEGIN_OPERATION('DBOP_EXAMPLE');
declare
--
v1 number;
--
CURSOR c1 IS
SELECT cust_city
  FROM (SELECT COUNT(*) cnt, cust_city
        FROM sh.customers GROUP BY cust_city
        ORDER BY 1 desc);
--
BEGIN
FOR i IN c1
LOOP
--
v1 := 0;
--
SELECT MAX(amount_sold)
INTO v1
FROM sh.sales
WHERE cust_id IN (select cust_id FROM sh.customers WHERE cust_city=i.cust_city);
--
DBMS_OUTPUT.PUT_LINE('Amount: '||v1);
--
END LOOP;
--
END;
/
SELECT MAX(asld) FROM
(SELECT MAX(amount_sold) asld, cust_id FROM sh.sales WHERE cust_id IN
  (SELECT cust_id FROM sh.customers WHERE cust_city IN
    (SELECT cust_city FROM
     (SELECT count(*) cnt, cust_city FROM sh.customers
      GROUP BY cust_city HAVING COUNT(*) > 1)
    ))
GROUP BY cust_id)
/

EXEC DBMS_SQL_MONITOR.END_OPERATION('DBOP_EXAMPLE',:eid);
See Also:
-
Oracle Database SQL Tuning Guide for information on monitoring database operations using an API
-
Oracle Database PL/SQL Packages and Types Reference for information on the
DBMS_SQL_MONITORpackage
Monitoring Database Operations in Cloud Control
The Monitored SQL Executions page displays a table of database operations that are currently running or have completed. With a selection from the Top 100 By list, you can order the rows of the table by aspects of the operations such as Last Active Time, Duration, or CPU Time. With a selection from the Type list, you can show all of the operations or filter the rows to show only the SQL, PL/SQL, or database operations.
The table contains data about the operations, such as the status and type of the operation, the operation ID, the database time consumed, the SQL text, if appropriate, and so on. The values in some columns are links to other pages or display information when the cursor points to them. For example, the value in the ID column is a link to the Monitored SQL Execution Details page. Another example is that when the cursor points to the bar in the Database Time column, a context message appears that displays information such as the wait class, the amount of time, and the percentage of database time. For example, pointing to the bar in the Database Time column displays a message such as CPU: 2.8m (92%). The Execution Detail, SQL Detail, and Session Detail controls above the table become active when you select a row from the table.
This section contains the following topics:
See Also:
-
Cloud Control Online Help for descriptions of the elements on the Monitored SQL Executions Details page
Viewing SQL Execution Details for a Composite Database Operation
This topic describes how to view the execution details for a composite database operation.
To view execution details for a composite database operation:
-
Access the Database Home page.
See "Accessing the Database Home Page" for more information.
-
From the Performance menu, select SQL Monitoring.
If the Database Login page appears, then log in as a user with administrator privileges. The Monitored SQL Execution page appears.
-
Click the ID of a composite database operation in the table.
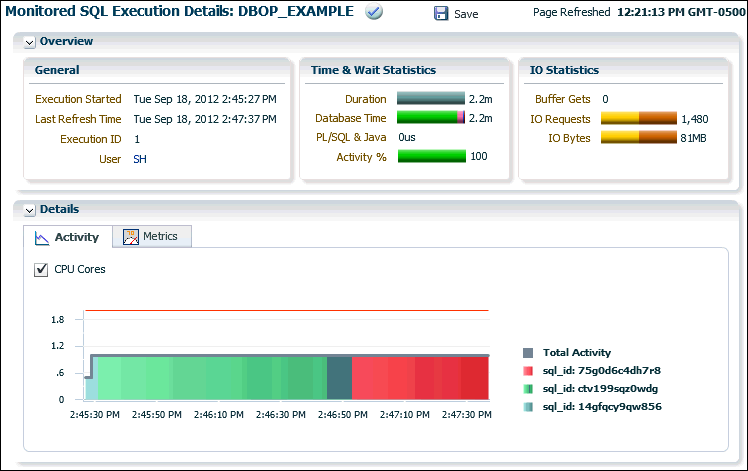
For example, in Figure 5-1 click
DBOP_EXAMPLE.The Monitored SQL Execution Details page for the operation appears. In the Details section, the Activity subpage is selected by default. Selecting an area in the Activity chart or selecting the corresponding SQL ID value in the legend displays the SQL Details page for that statement.

Description of the illustration mon_sql_details_dbop.gif
-
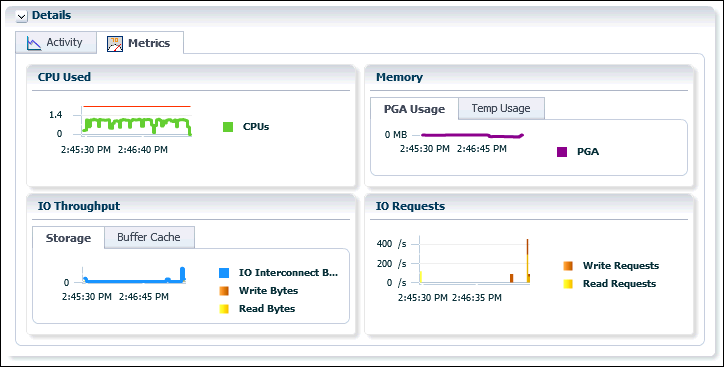
To view metrics of the operation, click the Metrics tab.
The Metrics subpage appears.

Description of the illustration mon_sql_dtls_dbop_mtrc.gif
Viewing SQL Execution Details for a SQL Statement
This topic describes how to view the execution details for a SQL statement.
To view execution details for a SQL statement:
-
Access the Database Home page.
See "Accessing the Database Home Page" for more information.
-
From the Performance menu, select SQL Monitoring.
If the Database Login page appears, then log in as a user with administrator privileges. The Monitored SQL Execution page appears.
-
Click the ID of a SQL statement in the table.
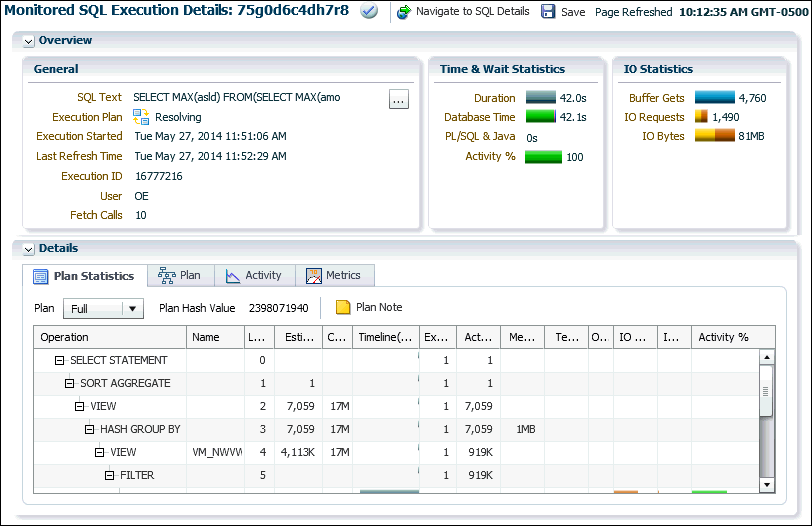
For example, in Figure 5-1 click
75g0d6c4dh7r8.The Monitored SQL Execution Details page for the operation appears. In the Details section, the Plan Statistics subpage is selected by default.

Description of the illustration mon_sql_details_sql.gif
Viewing SQL Execution Details for a PL/SQL Statement
This topic describes viewing the execution details for a PL/SQL statement.
To view execution details for a PL/SQL statement:
-
Access the Database Home page.
See "Accessing the Database Home Page" for more information.
-
From the Performance menu, select SQL Monitoring.
If the Database Login page appears, then log in as a user with administrator privileges. The Monitored SQL Execution page appears.
-
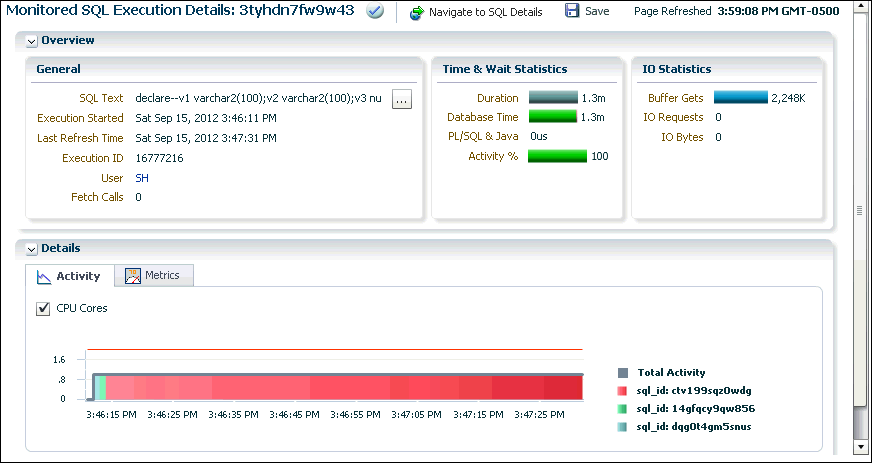
Click the ID of a PL/SQL statement in the table.
The Monitored SQL Execution Details page for the operation appears. In the Details section, the Activity subpage is selected by default.

Description of the illustration mon_sql_details_plsql.gif
