16 Monitoring Database Operations
This chapter describes how to monitor database operations.
This chapter contains the following topics:
About Monitoring Database Operations
A database operation is a set of database tasks defined by end users or application code, for example, a batch job or Extraction, Transformation, and Loading (ETL) processing. You can define, monitor, and report on database operations.
Database operations are either simple or composite. A simple database operation is a single SQL statement or PL/SQL procedure or function. A composite database operation is activity between two points in time in a database session, with each session defining its own beginning and end points. A session can participate in at most one composite database operation at a time.
Real-Time SQL Monitoring, which was introduced in Oracle Database 11g, enables you to monitor a single SQL statement or PL/SQL procedure. Starting in Oracle Database 12c, Real-Time Database Operations provides the ability to monitor composite operations automatically. The database automatically monitors parallel queries, DML, and DDL statements as soon as execution begins. By default, Real-Time SQL Monitoring automatically starts when a SQL statement runs in parallel, or when it has consumed at least 5 seconds of CPU or I/O time in a single execution.
This section contains the following topics:
See Also:
Oracle Database Concepts for a brief conceptual overview of database operations
Purpose of Monitoring Database Operations
In general, monitoring database operations is useful for the following users:
-
DBAs whose responsibilities include identifying expensive (high response time) SQL statements and PL/SQL functions
-
DBAs who manage batch jobs in a data warehouse or OLTP system
-
Application or database developers who need to monitor the activities related to particular operations, for example, Data Pump operations
Monitoring database operations is useful for performing the following tasks:
-
Tracking and reporting
Tracking requires first defining a database operation, for example, though PL/SQL, OCI, or JDBC APIs. After the operation is defined, the database infrastructure determines what to track on behalf of this operation. You can then generate reports on the operation. For example, your tuning task may involve determining which SQL statements run on behalf of a specific batch job, what their execution statistics were, what was occurring in the database when the operation was executing, and so on.
-
Monitoring execution progress
This task involves monitoring a currently executing database operation. The information is particularly useful when you are investigating why an operation is taking a long time to complete.
-
Monitoring resource usage
You may want to detect when a SQL execution uses excessive CPU, issues an excessive amount of I/O, or takes a long time to complete. With Oracle Database Resource Manager (the Resource Manager), you can configure thresholds for each consumer group that specify the maximum resource usage for all SQL executions in the group. When a SQL operation reaches a specified threshold, Resource Manager can switch the operation into a lower-priority consumer group, terminate the session or call, or log the event (see Oracle Database Administrator's Guide). You can then monitor these SQL operations (see "Reporting on Database Operations Using SQL Monitor").
-
Tuning for response time
When tuning a database operation, you typically aim to improve the response time. Often the database operation performance issues are mainly SQL performance issues.
The following graphic illustrates the different tasks involved in monitoring database operations:
Simple Database Operation Use Cases
For simple operations, Real-Time SQL Monitoring helps determine where a currently executing SQL statement is in its execution plan and where the statement is spending its time. You can also see the breakdown of time and resource usage for recently completed statements. In this way, you can better determine why a particular operation is expensive.
Typical use cases for Real-Time SQL Monitoring include the following:
-
A frequently executed SQL statement is executing more slowly than normal. You must identify the root cause of this problem.
-
A database session is experiencing slow performance.
-
A parallel SQL statement is taking a long time. You want to determine how the server processes are dividing the work.
Composite Database Operation Use Cases
In OLTP and data warehouse environments, a job often logically groups related SQL statements. The job can involve multiple sessions. Database operation monitoring is useful for digging through a suboptimally performing job to determine where resources are being consumed. Thus, database operations enable you to track related information and improve performance tuning time.
Typical use cases for monitoring composite operations include the following:
-
A periodic batch job containing many SQL statements must complete in a certain number of hours, but took twice as long as expected.
-
After a database upgrade, the execution time of an important batch job doubled. To resolve this problem, you must collect enough relevant statistical data from the batch job before and after the upgrade, compare the two sets of data, and then identify the changes.
-
Packing a SQL tuning set (STS) took far longer than anticipated (see "About SQL Tuning Sets"). To diagnose the problem, you need to know what was being executed over time. Because this issue cannot be easily reproduced, you need to monitor the process while it is running.
Database Operation Monitoring Concepts
This section describes the most important concepts for database monitoring:
About the Architecture of Database Operations
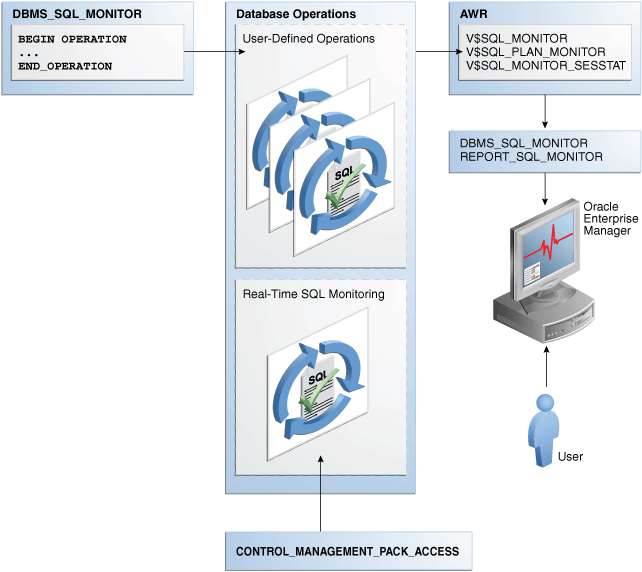
Setting the CONTROL_MANAGEMENT_PACK_ACCESS initialization parameter to DIAGNOSTIC+TUNING (default) enables monitoring of database operations. Real-Time SQL Monitoring is a feature of the Oracle Database Tuning Pack.
Figure 16-1 gives an overview of the architecture for database operations.
Figure 16-1 Architecture for Database Operations
Description of "Figure 16-1 Architecture for Database Operations"
As shown in Figure 16-1, you can use the DBMS_SQL_MONITOR package to define database operations. After monitoring is initiated, the database stores metadata about the database operations in AWR (see "Reporting on Database Operations Using SQL Monitor"). The database refreshes monitoring statistics in close to real time as each monitored statement executes, typically once every second. The database periodically saves the data to disk.
Every monitored database operation has an entry in the V$SQL_MONITOR view. This entry tracks key performance metrics collected for the execution, including the elapsed time, CPU time, number of reads and writes, I/O wait time, and various other wait times. The V$SQL_PLAN_MONITOR view includes monitoring statistics for each operation in the execution plan of the SQL statement being monitored. You can access reports by using DBMS_SQL_MONITOR.REPORT_SQL_MONITOR, which has an Oracle Enterprise Manager Cloud Control (Cloud Control) interface.
See Also:
-
Oracle Database Reference to learn about the initialization parameters and views related to database monitoring
-
Oracle Database PL/SQL Packages and Types Reference to learn about
DBMS_SQLTUNEandDBMS_SQL_MONITORpackages
Composite Database Operations
A composite database operation consists of the activity of one session between two points in time. Exactly one session exists for the duration of the database operation.
SQL statements or PL/SQL procedures running in this session are part of the composite operation. Composite database operations can also be defined in the database kernel. Typical composite operations include SQL*Plus scripts, batch jobs, and ETL processing.
Attributes of Database Operations
A database operation is uniquely identified by the following information:
-
Database operation name
This is a user-created name such as
daily_sales_report. The name is the same for a job even if it is executed concurrently by different sessions or on different databases. Database operation names do not reside in different namespaces. -
Database operation execution ID
Two or more occurrences of the same DB operation can run at the same time, with the same name but different execution IDs. This numeric ID uniquely identifies different executions of the same database operation.
The database automatically creates an execution ID when you begin a database operation. You can also specify a user-created execution ID.
The database uses the following triplet of values to identify each SQL and PL/SQL statement monitored in the V$SQL_MONITOR view, regardless of whether the statement is included in a database operation:
-
SQL identifier to identify the SQL statement (
SQL_ID) -
Start execution timestamp (
SQL_EXEC_START) -
An internally generated identifier to ensure that this primary key is truly unique (
SQL_EXEC_ID)
You can use zero or more additional attributes to describe and identify the characteristics of a DB operation. Each attribute has a name and value. For example, for operation daily_sales_report, you might define the attribute db_name and assign it the value prod.
See Also:
-
Oracle Database Reference to learn about the
V$SQL_MONITORview -
Oracle Database PL/SQL Packages and Types Reference to learn about the
DBMS_SQL_MONITOR.BEGIN_OPERATIONfunction
User Interfaces for Database Operations Monitoring
This section contains the following topics:
Monitored SQL Executions Page in Cloud Control
Accessing the Monitored SQL Executions Page
To access the Monitored SQL Executions page:
-
Access the Database Home page, as described in "Accessing the Database Home Page in Cloud Control."
-
From the Performance menu, select SQL Monitoring.
The Monitored SQL Executions page appears.
DBMS_SQL_MONITOR Package
You can use the DBMS_SQL_MONITOR package to define the beginning and ending of a database operation, and generate a report of the database operations.
Table 16-1 DBMS_SQL_MONITOR
| Program Unit | Description |
|---|---|
|
|
This function accepts several input parameters to specify the execution, the level of detail in the report, and the report type. If no parameters are specified, then the function generates a text report for the last execution that was monitored. |
|
|
This function associates a session with a database operation. |
|
|
This function disassociates a session from the specified database operation execution. |
See Also:
Oracle Database PL/SQL Packages and Types Reference to learn about the DBMS_SQL_MONITOR package
Views for Database Operations Monitoring
You can monitor the statistics for SQL statement execution using the V$SQL_MONITOR, V$SQL_PLAN_MONITOR, and V$SQL_MONITOR_SESSTAT views. Table 16-2 summarizes these views.
Table 16-2 Views for Database Operations Monitoring
| View | Description |
|---|---|
|
|
This view contains global, high-level information about the top SQL statements in a database operation. Each monitored SQL statement has an entry in this view. Each row contains a SQL statement whose statistics are accumulated from multiple sessions and all of its executions in the operation. The primary key is the combination of the columns The
|
|
|
This view contains the statistics for all sessions involved in the database operation. Most of the statistics are cumulative. The database stores the statistics in XML format instead of using each column for each statistic. This view is primarily intended for the report generator. Oracle recommends that you use |
|
|
This view contains monitoring statistics for each step in the execution plan of the monitored SQL statement. The database updates statistics in |
You can use the preceding views with the following views to get additional information about the monitored execution:
-
V$ACTIVE_SESSION_HISTORY -
V$SESSION -
V$SESSION_LONGOPS -
V$SQL -
V$SQL_PLAN
See Also:
Oracle Database Reference to learn about the V$ views for database operations monitoring
Basic Tasks in Database Operations Monitoring
This section explains the basic tasks in database operations monitoring. Basic tasks are as follows:
-
"Enabling and Disabling Monitoring of Database Operations"
This task explains how you can enable automatic monitoring of database operations at the system and statement level.
-
"Creating a Database Operation"
This section explains how you can define the beginning and end of a database operation using PL/SQL.
-
"Reporting on Database Operations Using SQL Monitor"
This section explains how you can generate and interpret reports on a database operation.
Enabling and Disabling Monitoring of Database Operations
This section contains the following topics:
Enabling Monitoring of Database Operations at the System Level
The SQL monitoring feature is enabled by default when the STATISTICS_LEVEL initialization parameter is either set to TYPICAL (the default value) or ALL. SQL monitoring starts automatically for all long-running queries.
Prerequisites
Because SQL monitoring is a feature of the Oracle Database Tuning Pack, the CONTROL_MANAGEMENT_PACK_ACCESS initialization parameter must be set to DIAGNOSTIC+TUNING (the default value).
Assumptions
This tutorial assumes the following:
-
The
STATISTICS_LEVELinitialization parameter is set toBASIC. -
You want to enable automatic monitoring of database operations.
To enable monitoring of database operations:
-
Connect SQL*Plus to the database with the appropriate privileges, and then query the current database operations settings.
For example, run the following SQL*Plus command:
SQL> SHOW PARAMETER statistics_level

NAME                                TYPE        VALUE
----------------------------------- ----------- -----
statistics_level                    string      BASIC
-
Set the statistics level to
TYPICAL.For example, run the following SQL statement:
SQL> ALTER SYSTEM SET STATISTICS_LEVEL='TYPICAL';
See Also:
Oracle Database Reference to learn about the STATISTICS_LEVEL and CONTROL_MANAGEMENT_PACK_ACCESS initialization parameter
Enabling and Disabling Monitoring of Database Operations at the Statement Level
When the CONTROL_MANAGEMENT_PACK_ACCESS initialization parameter is set to DIAGNOSTIC+TUNING, you can use hints to enable or disable monitoring of specific SQL statements. The MONITOR hint enables monitoring, whereas the NO_MONITOR hint disables monitoring.
Two statement-level hints are available to force or prevent the database from monitoring a SQL statement. To force SQL monitoring, use the MONITOR hint:
SELECT /*+ MONITOR */ SYSDATE FROM DUAL;
This hint is effective only when the CONTROL_MANAGEMENT_PACK_ACCESS parameter is set to DIAGNOSTIC+TUNING. To prevent the hinted SQL statement from being monitored, use the NO_MONITOR reverse hint.
Assumptions
This tutorial assumes the following:
-
Database monitoring is currently enabled at the system level.
-
You want to disable automatic monitoring for the statement
SELECT * FROM sales ORDER BY time_id.
To disable monitoring of database operations for a SQL statement:
-
Execute the query with the
NO_MONITORhint.For example, run the following statement:
SQL> SELECT * /*+NO_MONITOR*/ FROM sales ORDER BY time_id;
See Also:
Oracle Database SQL Language Reference for information about using the MONITOR and NO_MONITOR hints
Creating a Database Operation
Creating a database operation involves explicitly defining its beginning and end points. You can start a database operation by using the DBMS_SQL_MONITOR.BEGIN_OPERATION function and end the operation by using the DBMS_SQL_MONITOR.END_OPERATION procedure.
Assumptions
This tutorial assumes the following:
-
You are an administrator and want to query the number of items in the
sh.salestable and the number of customers in thesh.customerstable. -
You want these two queries to be monitored as a database operation named
sh_count.
To create a database operation:
-
Start SQL*Plus and connect as a user with the appropriate privileges.
-
Define a variable to hold the execution ID.
For example, run the following SQL*Plus command:
VAR eid NUMBER
-
Begin the database operation.
For example, execute the
BEGIN_OPERATIONfunction as follows:EXEC :eid := DBMS_SQL_MONITOR.BEGIN_OPERATION('sh_count'); -
Run the queries in the operation.
For example, run the following statements:
SQL> SELECT count(*) FROM sh.sales; COUNT(*) ---------- 918843 SQL> SELECT COUNT(*) FROM sh.customers; COUNT(*) ---------- 55500 -
End the database operation.
For example, execute the
END_OPERATIONprocedure as follows:EXEC DBMS_SQL_MONITOR.END_OPERATION('sh_count', :eid); -
Confirm that the database operation completed.
For example, run the following query (sample output included):
SELECT SUBSTR(DBOP_NAME, 1, 10), DBOP_EXEC_ID,
       SUBSTR(STATUS, 1, 10)
FROM  V$SQL_MONITOR
WHERE DBOP_NAME IS NOT NULL
ORDER BY EXEC_ID;

DBOP_NAME     EXEC_ID STATUS
---------- ---------- ----------
sh_count            1 DONE
See Also:
Oracle Database PL/SQL Packages and Types Reference to learn about the DBMS_SQL_MONITOR package
Reporting on Database Operations Using SQL Monitor
By default, AWR automatically captures SQL monitoring reports in XML format. The reports capture only SQL statements that are not executing or queued and have finished execution since the last capture cycle. AWR captures reports only for the most expensive statements according to elapsed execution time.
The Monitored SQL Executions page in Cloud Control summarizes the activity for monitored statements. You can use this page to drill down and obtain additional details about particular statements. The Monitored SQL Executions Details page uses data from several views, including the following:
-
GV$SQL_MONITOR -
GV$SQL_PLAN_MONITOR -
GV$SQL_MONITOR_SESSTAT -
GV$SQL -
GV$SQL_PLAN -
GV$ACTIVE_SESSION_HISTORY -
GV$SESSION_LONGOPS -
DBA_HIST_REPORTS -
DBA_HIST_REPORTS_DETAILS
Assumptions
This tutorial assumes the following:
-
The user
shis executing the following long-running parallel query of the sales made to each customer:SELECT c.cust_id, c.cust_last_name, c.cust_first_name, s.prod_id, p.prod_name, s.time_id FROM sales s, customers c, products p WHERE s.cust_id = c.cust_id AND s.prod_id = p.prod_id ORDER BY c.cust_id, s.time_id; -
You want to ensure that the preceding query does not consume excessive resources. While the statement executes, you want to determine basic statistics about the database operation, such as the level of parallelism, the total database time, and number of I/O requests.
-
You use Cloud Control to monitor statement execution.
Note:
To generate the SQL monitor report from the command line, run the
REPORT_SQL_MONITORfunction in theDBMS_SQLTUNEpackage, as in the following sample SQL*Plus script:VARIABLE my_rept CLOB BEGIN :my_rept :=DBMS_SQLTUNE.REPORT_SQL_MONITOR(); END; / PRINT :my_rept
To monitor SQL executions:
-
Access the Monitored SQL Executions page, as described in "Monitored SQL Executions Page in Cloud Control".
In the following graphic, the top row shows the parallel query.
In this example, the query has been executing for 1.4 minutes.
-
Click the value in the SQL ID column to see details about the statement.
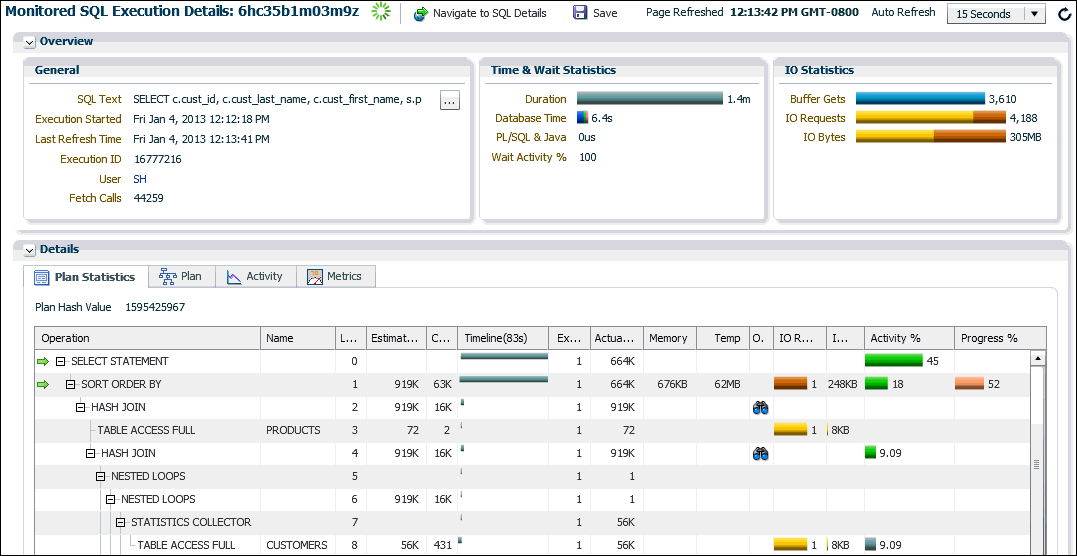
The Monitored SQL Details page appears.
The preceding report shows the execution plan and statistics relating to statement execution. For example, the Timeline column shows when each step of the execution plan was active. Times are shown relative to the beginning and end of the statement execution. The Executions column shows how many times an operation was executed.
-
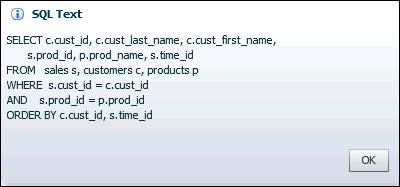
In the Overview section, click the link next to the SQL text.
A message shows the full text of the SQL statement.
-
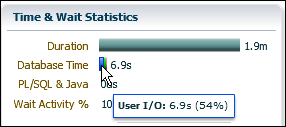
In the Time & Wait Statistics section, next to Database Time, move the cursor over the largest portion on the bar graph.
A message shows that user I/O is consuming over half of database time.
Database Time measures the amount of time the database has spent working on this SQL statement. This value includes CPU and wait times, such as I/O time. The bar graph is divided into several color-coded portions to highlight CPU resources, user I/O resources, and other resources. You can move the cursor over any portion to view the percentage value of the total.
-
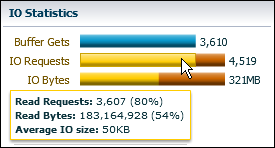
In the Details section, in the IO Requests column, move the cursor over the I/O requests bar to view the percentage value of the total.
A message appears.
In the preceding graphic, the IO Requests message shows the total number of read requests issued by the monitored SQL. The message shows that read requests form 80% of the total I/O requests.
See Also:
-
Cloud Control Online Help for descriptions of the elements on the Monitored SQL Executions Details page, and for complete descriptions of all statistics in the report.
-
Oracle Database Reference to learn about the
V$and data dictionary views for database operations monitoring


